Estimated Value: $193,000 - $218,000
3
Beds
2
Baths
1,356
Sq Ft
$152/Sq Ft
Est. Value
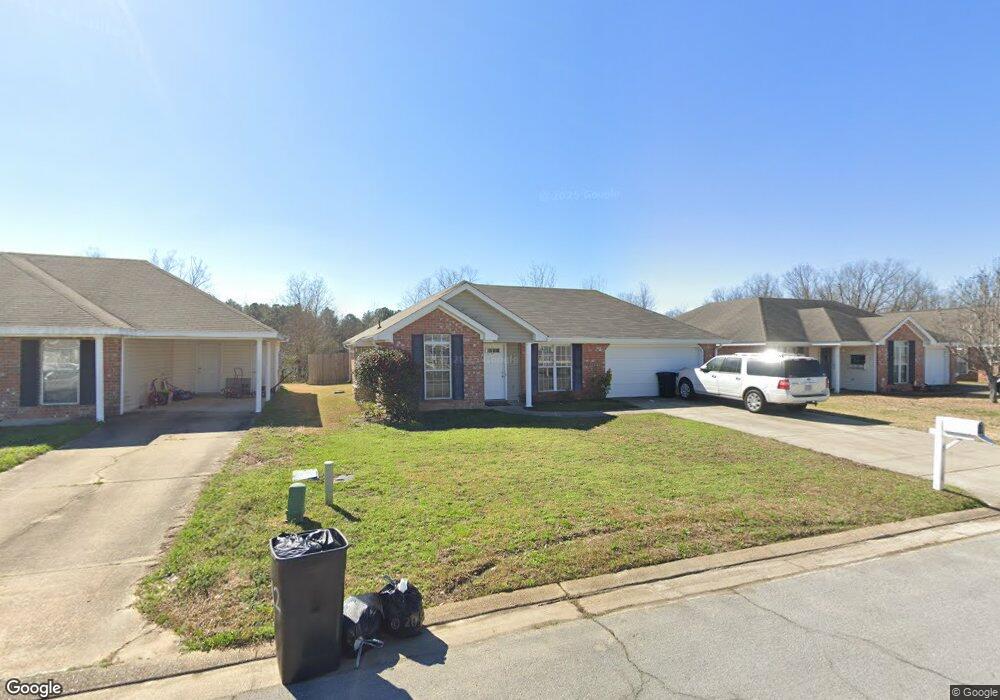
About This Home
This home is located at 110 Cedar Springs Cir, Pearl, MS 39208 and is currently estimated at $206,219, approximately $152 per square foot. 110 Cedar Springs Cir is a home located in Rankin County with nearby schools including McLaurin Elementary School.
Ownership History
Date
Name
Owned For
Owner Type
Purchase Details
Closed on
Aug 13, 2024
Sold by
Harrison Kevin
Bought by
Patel Akash
Current Estimated Value
Home Financials for this Owner
Home Financials are based on the most recent Mortgage that was taken out on this home.
Original Mortgage
$145,600
Outstanding Balance
$143,977
Interest Rate
6.95%
Mortgage Type
New Conventional
Estimated Equity
$62,242
Purchase Details
Closed on
May 30, 2013
Sold by
Bischoff John Stephen and Bischoff Brittany N
Bought by
Harrison Wanda E and Harrison Kevin
Home Financials for this Owner
Home Financials are based on the most recent Mortgage that was taken out on this home.
Original Mortgage
$93,600
Interest Rate
3.37%
Purchase Details
Closed on
May 29, 2007
Sold by
Woodbridge Inc
Bought by
Bischoff John Steven and Bischoff Brittany N
Home Financials for this Owner
Home Financials are based on the most recent Mortgage that was taken out on this home.
Original Mortgage
$124,800
Interest Rate
6.12%
Create a Home Valuation Report for This Property
The Home Valuation Report is an in-depth analysis detailing your home's value as well as a comparison with similar homes in the area
Home Values in the Area
Average Home Value in this Area
Purchase History
| Date | Buyer | Sale Price | Title Company |
|---|---|---|---|
| Patel Akash | -- | Luckett Land Title | |
| Harrison Wanda E | -- | -- | |
| Bischoff John Steven | -- | Closing & Title Services, Ll |
Source: Public Records
Mortgage History
| Date | Status | Borrower | Loan Amount |
|---|---|---|---|
| Open | Patel Akash | $145,600 | |
| Previous Owner | Harrison Wanda E | $93,600 | |
| Previous Owner | Bischoff John Steven | $124,800 |
Source: Public Records
Tax History Compared to Growth
Tax History
| Year | Tax Paid | Tax Assessment Tax Assessment Total Assessment is a certain percentage of the fair market value that is determined by local assessors to be the total taxable value of land and additions on the property. | Land | Improvement |
|---|---|---|---|---|
| 2024 | $1,827 | $18,513 | $0 | $0 |
| 2023 | $1,817 | $18,407 | $0 | $0 |
| 2022 | $1,790 | $18,407 | $0 | $0 |
| 2021 | $1,790 | $18,407 | $0 | $0 |
| 2020 | $1,790 | $18,407 | $0 | $0 |
| 2019 | $1,652 | $16,515 | $0 | $0 |
| 2018 | $1,618 | $16,515 | $0 | $0 |
| 2017 | $1,618 | $16,515 | $0 | $0 |
| 2016 | $1,476 | $15,872 | $0 | $0 |
| 2015 | $1,476 | $15,872 | $0 | $0 |
| 2014 | $1,442 | $15,872 | $0 | $0 |
| 2013 | $662 | $10,581 | $0 | $0 |
Source: Public Records
Map
Nearby Homes
- Aldridge Plan at Cedar Lane
- Freeport Plan at Cedar Lane
- 605 Cedar Hill Dr
- 606 Cedar Hill Dr
- 406 Cedar Hill Dr
- 103 Cedar Ridge Blvd
- 305 Cedar Crest Dr
- 304 Cedar Hill Dr
- 307 Cedar Crest Dr
- 508 Ridgecrest Dr
- 607 Cedar Place
- 603 Cedar Place
- 605 Cedar Place
- 308 London Way
- 320 Cedar Hill Dr
- 00 Whitfield Rd
- 243 Trace Dr
- 241 Trace Dr
- 505 Arden Dr
- 317 Willow Run
- 110 Cedar Spring Cir
- 112 Cedar Spring Cir
- 0 Cedar Spring Cir Unit Lot 79 (109 1175220
- 114 Cedar Spring Cir
- 114 Cedar Spring Cir Unit ( Lot 72 )
- 106 Cedar Spring Cir
- 111 Cedar Spring Cir
- 111 Cedar Spring Cir Unit ( Lot 80 )
- 109 Cedar Spring Cir
- 116 Cedar Springs Cir
- 116 Cedar Spring Cir
- 116 Cedar Spring Cir Unit (LOT71)
- 113 Cedar Spring Cir
- 107 Cedar Spring Cir
- 107 Cedar Spring Cir Unit CIR
- 107 Cedar Springs Cir
- 104 Cedar Spring Cir
- 115 Cedar Spring Cir
- 115 Cedar Spring Cir Unit (Lot 82 )
- 118 Cedar Spring Cir