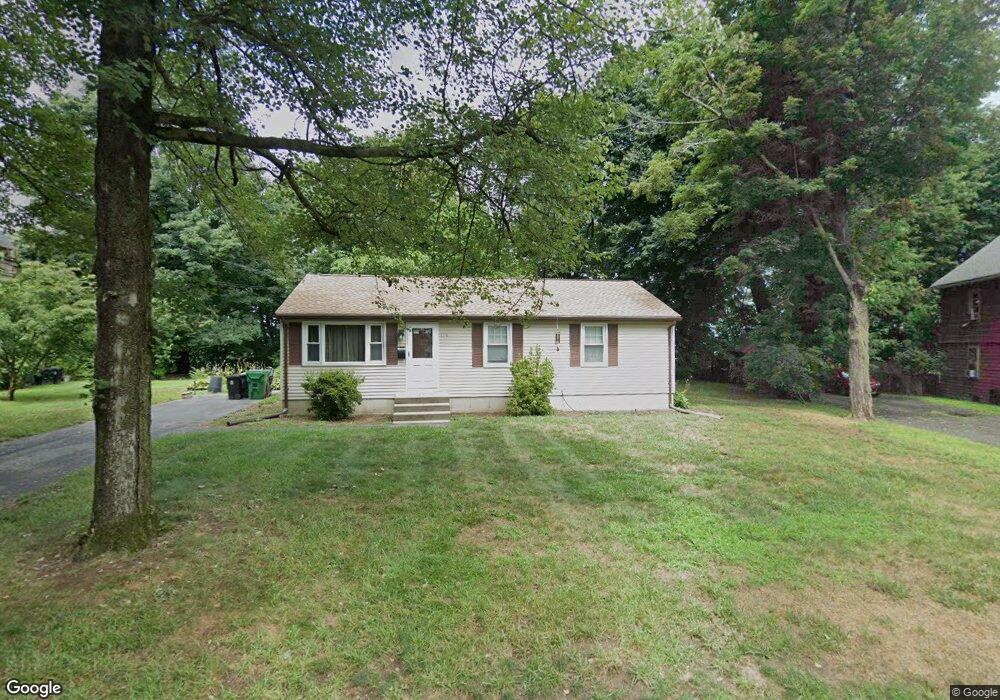
110 Chapin St Chicopee, MA 01013
Chicopee Center NeighborhoodEstimated Value: $253,000 - $291,894
3
Beds
1
Bath
1,008
Sq Ft
$273/Sq Ft
Est. Value
About This Home
This home is located at 110 Chapin St, Chicopee, MA 01013 and is currently estimated at $275,474, approximately $273 per square foot. 110 Chapin St is a home located in Hampden County with nearby schools including Bowe Elementary School, Fairview Middle School, and Chicopee High School.
Ownership History
Date
Name
Owned For
Owner Type
Purchase Details
Closed on
Sep 1, 1984
Bought by
Sulewski Walter F and Sulewski Karen A
Current Estimated Value
Create a Home Valuation Report for This Property
The Home Valuation Report is an in-depth analysis detailing your home's value as well as a comparison with similar homes in the area
Home Values in the Area
Average Home Value in this Area
Purchase History
| Date | Buyer | Sale Price | Title Company |
|---|---|---|---|
| Sulewski Walter F | $59,900 | -- |
Source: Public Records
Mortgage History
| Date | Status | Borrower | Loan Amount |
|---|---|---|---|
| Closed | Sulewski Walter F | $71,000 | |
| Closed | Sulewski Walter F | $67,000 | |
| Closed | Sulewski Walter F | $65,000 | |
| Closed | Sulewski Walter F | $13,100 |
Source: Public Records
Tax History
| Year | Tax Paid | Tax Assessment Tax Assessment Total Assessment is a certain percentage of the fair market value that is determined by local assessors to be the total taxable value of land and additions on the property. | Land | Improvement |
|---|---|---|---|---|
| 2025 | $3,311 | $218,400 | $71,700 | $146,700 |
| 2024 | $3,138 | $212,600 | $70,300 | $142,300 |
| 2023 | $2,904 | $191,700 | $63,900 | $127,800 |
| 2022 | $2,780 | $163,600 | $55,500 | $108,100 |
| 2021 | $2,633 | $149,500 | $50,500 | $99,000 |
| 2020 | $2,493 | $142,800 | $50,500 | $92,300 |
| 2019 | $2,443 | $136,000 | $50,500 | $85,500 |
| 2018 | $2,384 | $130,200 | $48,100 | $82,100 |
| 2017 | $2,255 | $130,300 | $51,200 | $79,100 |
| 2016 | $2,212 | $130,800 | $51,200 | $79,600 |
| 2015 | $2,406 | $137,200 | $51,200 | $86,000 |
| 2014 | $1,203 | $137,200 | $51,200 | $86,000 |
Source: Public Records
Map
Nearby Homes
- 116 Chapin St
- 116 Chapin St Unit 1
- 116 Chapin St Unit 3
- 92 Chapin St
- 92 Chapin St
- 101 Chapin St
- 101 Chapin St Unit 2a
- 115 South St Unit 16
- 115 South St Unit 15
- 115 South St Unit 14
- 115 South St Unit 13
- 115 South St Unit 12
- 115 South St Unit 11
- 115 South St Unit 10
- 115 South St Unit 9
- 115 South St Unit 8
- 115 South St Unit 7
- 115 South St Unit 6
- 115 South St Unit 5
- 115 South St Unit 4
Your Personal Tour Guide
Ask me questions while you tour the home.