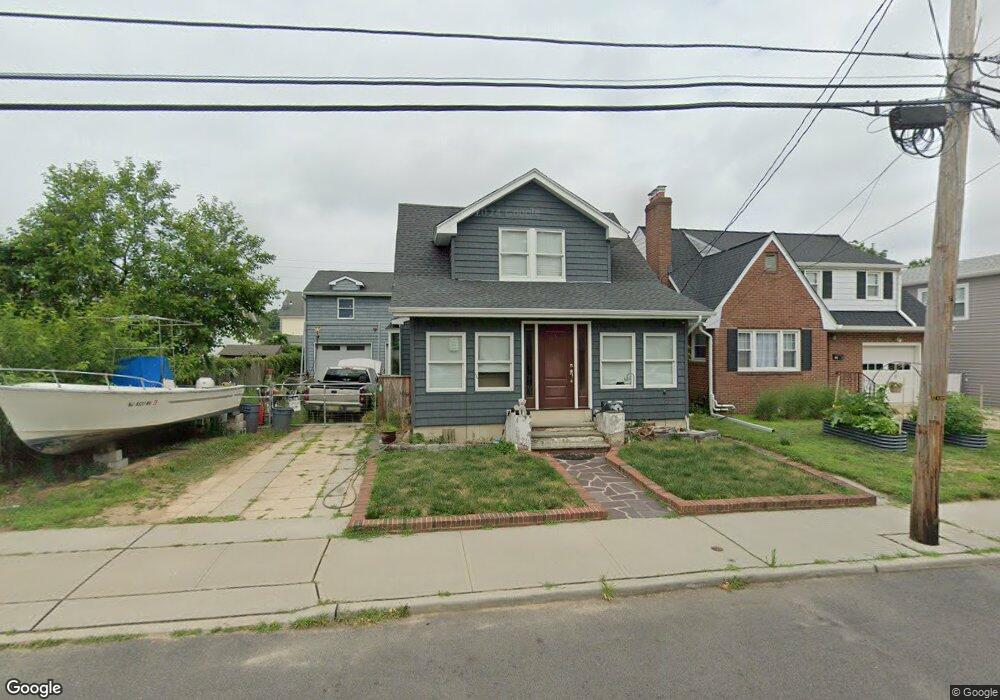
110 Chingarora Ave Keyport, NJ 07735
Estimated Value: $410,000 - $476,981
2
Beds
2
Baths
932
Sq Ft
$476/Sq Ft
Est. Value
About This Home
This home is located at 110 Chingarora Ave, Keyport, NJ 07735 and is currently estimated at $443,245, approximately $475 per square foot. 110 Chingarora Ave is a home located in Monmouth County with nearby schools including Keyport Central School, Keyport High School, and Icob Academy.
Ownership History
Date
Name
Owned For
Owner Type
Purchase Details
Closed on
Sep 29, 2006
Sold by
Slowicki Gregory
Bought by
Yakubics Edward and Boyce Laura
Current Estimated Value
Home Financials for this Owner
Home Financials are based on the most recent Mortgage that was taken out on this home.
Original Mortgage
$22,500
Outstanding Balance
$13,485
Interest Rate
6.54%
Mortgage Type
Stand Alone Second
Estimated Equity
$429,760
Create a Home Valuation Report for This Property
The Home Valuation Report is an in-depth analysis detailing your home's value as well as a comparison with similar homes in the area
Home Values in the Area
Average Home Value in this Area
Purchase History
| Date | Buyer | Sale Price | Title Company |
|---|---|---|---|
| Yakubics Edward | $225,000 | -- |
Source: Public Records
Mortgage History
| Date | Status | Borrower | Loan Amount |
|---|---|---|---|
| Open | Yakubics Edward | $22,500 |
Source: Public Records
Tax History Compared to Growth
Tax History
| Year | Tax Paid | Tax Assessment Tax Assessment Total Assessment is a certain percentage of the fair market value that is determined by local assessors to be the total taxable value of land and additions on the property. | Land | Improvement |
|---|---|---|---|---|
| 2025 | $8,355 | $443,500 | $221,100 | $222,400 |
| 2024 | $8,227 | $403,600 | $192,300 | $211,300 |
| 2023 | $8,227 | $374,300 | $174,800 | $199,500 |
| 2022 | $6,951 | $325,500 | $152,000 | $173,500 |
| 2021 | $6,951 | $275,400 | $140,800 | $134,600 |
| 2020 | $6,696 | $263,300 | $135,300 | $128,000 |
| 2019 | $6,477 | $255,100 | $130,000 | $125,100 |
| 2018 | $6,422 | $247,000 | $130,000 | $117,000 |
| 2017 | $6,272 | $240,600 | $125,000 | $115,600 |
| 2016 | $6,703 | $226,600 | $125,000 | $101,600 |
| 2015 | $6,300 | $242,600 | $110,000 | $132,600 |
| 2014 | $4,799 | $186,600 | $85,000 | $101,600 |
Source: Public Records
Map
Nearby Homes
- 127 Chingarora Ave
- 253 Broadway
- 1 Hobart St
- 52 Highway 35
- 95 Broadway
- 8 Chingarora Ave
- 324 Maple Place
- 9 Monmouth Place
- 22 Lower Main St
- 90 Saint Peters Place
- 369 Riverdale Dr
- 557 Lloyd Rd Unit B
- 226 Osborn St
- 47 Village Green Way
- 195 Atlantic St
- 40 Church St
- 55 E Front St
- 231 Atlantic St Unit 23
- 23 Mathiasen Place
- 118 Village Green Way
- 108 Chingarora Ave
- 120 Chingarora Ave
- 106 Chingarora Ave
- 207 Broadway
- 207 Broadway Unit 1
- 205 Broadway
- 122 Chingarora Ave
- 211 Broadway
- 104 Chingarora Ave
- 203 Broadway
- 115 Chingarora Ave
- 213 Broadway
- 124 Chingarora Ave
- 117 Chingarora Ave
- 113 Chingarora Ave
- 199 Broadway
- 119 Chingarora Ave
- 111 Chingarora Ave
- 121 Chingarora Ave
- 99 Chingarora Ave