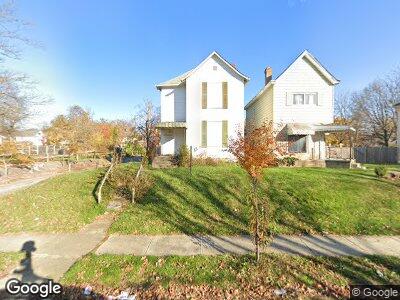
110 Clarendon Ave Columbus, OH 43223
Central Hilltop NeighborhoodEstimated Value: $128,000 - $176,000
2
Beds
2
Baths
1,350
Sq Ft
$110/Sq Ft
Est. Value
About This Home
This home is located at 110 Clarendon Ave, Columbus, OH 43223 and is currently estimated at $148,293, approximately $109 per square foot. 110 Clarendon Ave is a home located in Franklin County with nearby schools including Highland Elementary School, Westmoor Middle School, and West High School.
Ownership History
Date
Name
Owned For
Owner Type
Purchase Details
Closed on
Apr 3, 2003
Sold by
Burket Richard A and Burket Vickie Lee
Bought by
Abg Properties Llc
Current Estimated Value
Purchase Details
Closed on
Oct 30, 2001
Sold by
Miller Loretha L
Bought by
Burket Richard
Purchase Details
Closed on
Jul 19, 2001
Sold by
Watkins William
Bought by
Miller Loretha L
Purchase Details
Closed on
Jun 8, 1998
Sold by
Miller Loretha L
Bought by
Watkins William
Home Financials for this Owner
Home Financials are based on the most recent Mortgage that was taken out on this home.
Original Mortgage
$28,000
Interest Rate
10.75%
Mortgage Type
Seller Take Back
Purchase Details
Closed on
Oct 12, 1994
Sold by
Campbell Michael W
Bought by
Loretha L Miller
Create a Home Valuation Report for This Property
The Home Valuation Report is an in-depth analysis detailing your home's value as well as a comparison with similar homes in the area
Home Values in the Area
Average Home Value in this Area
Purchase History
| Date | Buyer | Sale Price | Title Company |
|---|---|---|---|
| Abg Properties Llc | -- | Darby Creek Title Agency Ltd | |
| Burket Richard | $29,000 | Independent Title | |
| Miller Loretha L | $10,000 | Independent Title | |
| Watkins William | $33,000 | Landsel Title Agency Inc | |
| Loretha L Miller | $35,000 | -- |
Source: Public Records
Mortgage History
| Date | Status | Borrower | Loan Amount |
|---|---|---|---|
| Previous Owner | Burket Richard A | $29,600 | |
| Previous Owner | Watkins William | $28,000 | |
| Closed | Loretha L Miller | $0 |
Source: Public Records
Tax History Compared to Growth
Tax History
| Year | Tax Paid | Tax Assessment Tax Assessment Total Assessment is a certain percentage of the fair market value that is determined by local assessors to be the total taxable value of land and additions on the property. | Land | Improvement |
|---|---|---|---|---|
| 2024 | $1,742 | $38,010 | $6,020 | $31,990 |
| 2023 | $1,720 | $38,010 | $6,020 | $31,990 |
| 2022 | $778 | $14,640 | $2,000 | $12,640 |
| 2021 | $779 | $14,640 | $2,000 | $12,640 |
| 2020 | $781 | $14,640 | $2,000 | $12,640 |
| 2019 | $757 | $12,180 | $1,680 | $10,500 |
| 2018 | $792 | $12,180 | $1,680 | $10,500 |
| 2017 | $1,221 | $12,180 | $1,680 | $10,500 |
| 2016 | $1,357 | $13,380 | $3,960 | $9,420 |
| 2015 | $828 | $13,380 | $3,960 | $9,420 |
| 2014 | $830 | $13,380 | $3,960 | $9,420 |
| 2013 | $482 | $15,750 | $4,655 | $11,095 |
Source: Public Records
Map
Nearby Homes
- 95 Midland Ave
- 148-150 Midland Ave
- 204 Midland Ave
- 138 S Wheatland Ave
- 196 Whitethorne Ave
- 34-36 Midland Ave
- 139 Belvidere Ave
- 83 Belvidere Ave
- 2219 W Broad St
- 42 Whitethorne Ave
- 44 Whitethorne Ave
- 219 Belvidere Ave
- 106 S Oakley Ave
- 298 Clarendon Ave
- 2045 W Broad St
- 2011 Fairmont Ave
- 273 Wrexham Ave
- 353 Clarendon Ave
- 287 Wrexham Ave
- 152 S Eureka Ave
- 110 Clarendon Ave
- 116 Clarendon Ave
- 102 Clarendon Ave
- 98 Clarendon Ave
- 128 Clarendon Ave
- 92 Clarendon Ave
- 107 Midland Ave Unit 109
- 107-109 Midland Ave
- 107-109 Midland Ave Unit 2
- 113 Midland Ave Unit 115
- 113-115 Midland Ave
- 113-115 Midland Ave Unit 2
- 101 Midland Ave
- 132 Clarendon Ave
- 119 Midland Ave Unit 121
- 125 Midland Ave
- 89 Midland Ave
- 138 Clarendon Ave
- 131 Midland Ave