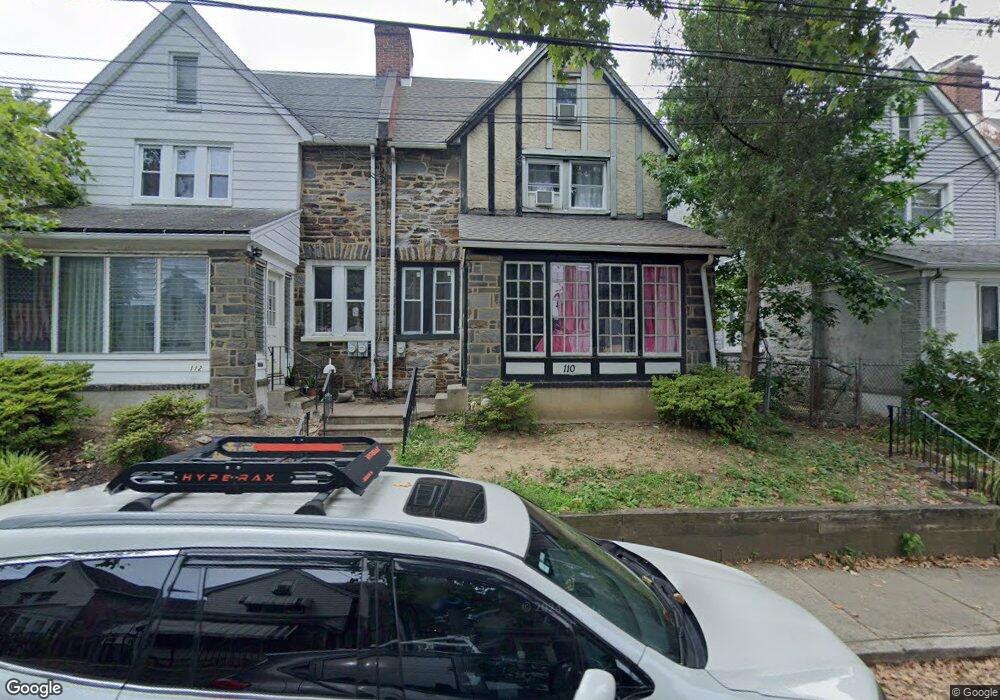
110 Copley Rd Upper Darby, PA 19082
Estimated Value: $230,000 - $294,000
3
Beds
1
Bath
2,021
Sq Ft
$126/Sq Ft
Est. Value
About This Home
This home is located at 110 Copley Rd, Upper Darby, PA 19082 and is currently estimated at $253,989, approximately $125 per square foot. 110 Copley Rd is a home located in Delaware County with nearby schools including Bywood Elementary School, Upper Darby Kdg Center, and Upper Darby High School.
Ownership History
Date
Name
Owned For
Owner Type
Purchase Details
Closed on
Sep 28, 2021
Sold by
Hossain Sakhawat and Rahman Sayma
Bought by
Farha Sanika & Allena Llc
Current Estimated Value
Purchase Details
Closed on
May 30, 2008
Sold by
Smith Bruce A and Smith Patricia H
Bought by
Hossain Sakhawat and Rahman Sayma
Home Financials for this Owner
Home Financials are based on the most recent Mortgage that was taken out on this home.
Original Mortgage
$89,240
Interest Rate
6.35%
Mortgage Type
Purchase Money Mortgage
Create a Home Valuation Report for This Property
The Home Valuation Report is an in-depth analysis detailing your home's value as well as a comparison with similar homes in the area
Home Values in the Area
Average Home Value in this Area
Purchase History
| Date | Buyer | Sale Price | Title Company |
|---|---|---|---|
| Farha Sanika & Allena Llc | -- | None Available | |
| Hossain Sakhawat | $92,000 | None Available |
Source: Public Records
Mortgage History
| Date | Status | Borrower | Loan Amount |
|---|---|---|---|
| Previous Owner | Hossain Sakhawat | $89,240 |
Source: Public Records
Tax History
| Year | Tax Paid | Tax Assessment Tax Assessment Total Assessment is a certain percentage of the fair market value that is determined by local assessors to be the total taxable value of land and additions on the property. | Land | Improvement |
|---|---|---|---|---|
| 2025 | $4,806 | $113,640 | $28,120 | $85,520 |
| 2024 | $4,806 | $113,640 | $28,120 | $85,520 |
| 2023 | $4,761 | $113,640 | $28,120 | $85,520 |
| 2022 | $4,633 | $113,640 | $28,120 | $85,520 |
| 2021 | $6,247 | $113,640 | $28,120 | $85,520 |
| 2020 | $4,465 | $69,030 | $16,630 | $52,400 |
| 2019 | $4,387 | $69,030 | $16,630 | $52,400 |
| 2018 | $4,336 | $69,030 | $0 | $0 |
| 2017 | $4,224 | $69,030 | $0 | $0 |
| 2016 | $379 | $69,030 | $0 | $0 |
| 2015 | $387 | $69,030 | $0 | $0 |
| 2014 | $379 | $69,030 | $0 | $0 |
Source: Public Records
Map
Nearby Homes
Your Personal Tour Guide
Ask me questions while you tour the home.