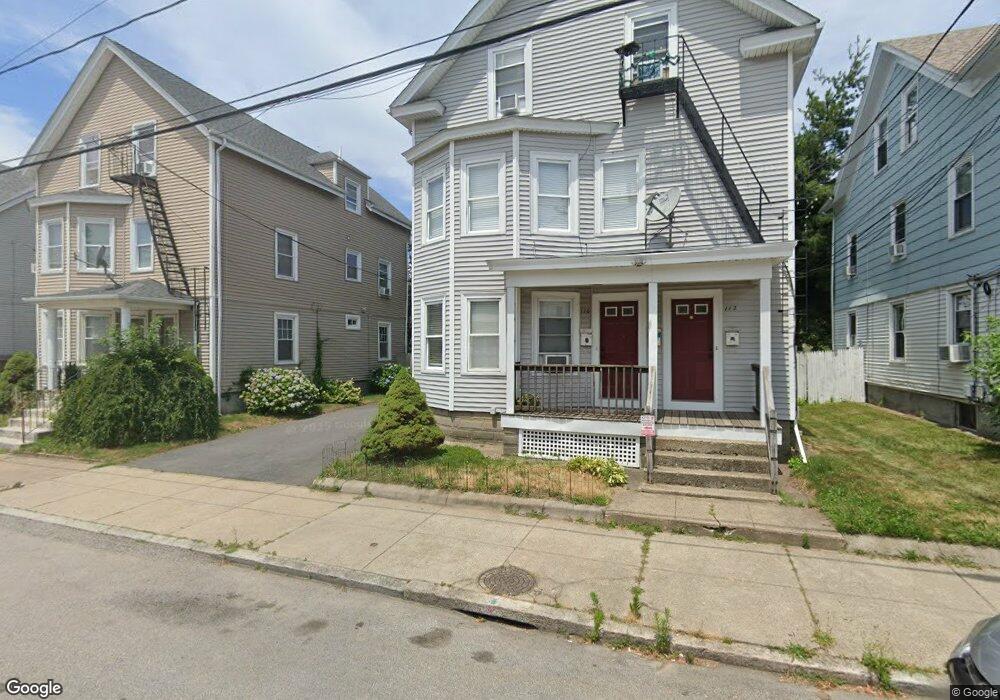
110 Coyle Ave Pawtucket, RI 02861
Darlington NeighborhoodEstimated Value: $317,372 - $614,000
6
Beds
3
Baths
2,474
Sq Ft
$206/Sq Ft
Est. Value
About This Home
This home is located at 110 Coyle Ave, Pawtucket, RI 02861 and is currently estimated at $510,343, approximately $206 per square foot. 110 Coyle Ave is a home located in Providence County with nearby schools including St Cecilia School and Saint Raphael Academy.
Ownership History
Date
Name
Owned For
Owner Type
Purchase Details
Closed on
Nov 23, 2024
Sold by
Desousa Jamie A and De Sousa Joshua
Bought by
Desousa Vasco
Current Estimated Value
Purchase Details
Closed on
Apr 3, 2023
Sold by
Desousa Vasco
Bought by
Desousa Jamie V and Desousa Joshua
Purchase Details
Closed on
Feb 27, 1996
Sold by
Amaral John P and Amaral Ana
Bought by
Sousa Vasco
Home Financials for this Owner
Home Financials are based on the most recent Mortgage that was taken out on this home.
Original Mortgage
$72,000
Interest Rate
7.04%
Create a Home Valuation Report for This Property
The Home Valuation Report is an in-depth analysis detailing your home's value as well as a comparison with similar homes in the area
Home Values in the Area
Average Home Value in this Area
Purchase History
| Date | Buyer | Sale Price | Title Company |
|---|---|---|---|
| Desousa Vasco | -- | None Available | |
| Desousa Vasco | -- | None Available | |
| Desousa Vasco | -- | None Available | |
| Desousa Jamie V | -- | None Available | |
| Desousa Jamie V | -- | None Available | |
| Sousa Vasco | $80,000 | -- | |
| Sousa Vasco | $80,000 | -- |
Source: Public Records
Mortgage History
| Date | Status | Borrower | Loan Amount |
|---|---|---|---|
| Previous Owner | Sousa Vasco | $72,000 |
Source: Public Records
Tax History
| Year | Tax Paid | Tax Assessment Tax Assessment Total Assessment is a certain percentage of the fair market value that is determined by local assessors to be the total taxable value of land and additions on the property. | Land | Improvement |
|---|---|---|---|---|
| 2025 | $5,900 | $448,700 | $114,700 | $334,000 |
| 2024 | $5,537 | $448,700 | $114,700 | $334,000 |
| 2023 | $5,138 | $303,300 | $88,400 | $214,900 |
| 2022 | $5,029 | $303,300 | $88,400 | $214,900 |
| 2021 | $5,029 | $303,300 | $88,400 | $214,900 |
| 2020 | $3,936 | $188,400 | $61,200 | $127,200 |
| 2019 | $3,936 | $188,400 | $61,200 | $127,200 |
| 2018 | $3,792 | $188,400 | $61,200 | $127,200 |
| 2017 | $3,610 | $158,900 | $47,400 | $111,500 |
| 2016 | $3,478 | $158,900 | $47,400 | $111,500 |
| 2015 | $3,478 | $158,900 | $47,400 | $111,500 |
| 2014 | $2,783 | $120,700 | $47,400 | $73,300 |
Source: Public Records
Map
Nearby Homes
Your Personal Tour Guide
Ask me questions while you tour the home.