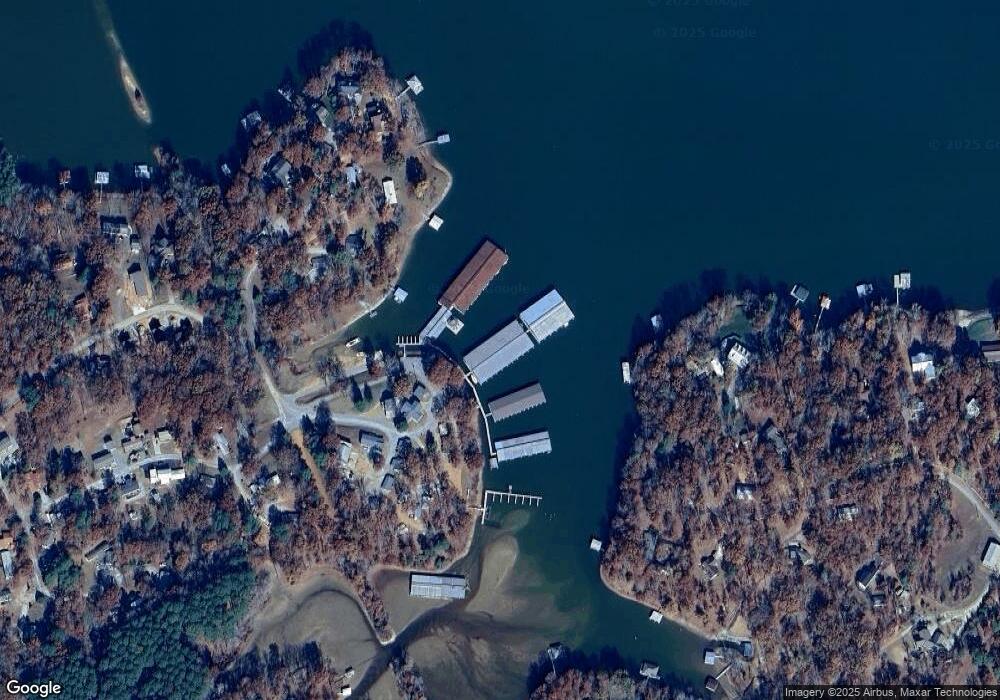
110 Cypress Resort Loop Buchanan, TN 38222
Estimated Value: $234,000 - $2,049,000
6
Beds
5
Baths
15,700
Sq Ft
$73/Sq Ft
Est. Value
About This Home
This home is located at 110 Cypress Resort Loop, Buchanan, TN 38222 and is currently estimated at $1,141,500, approximately $72 per square foot. 110 Cypress Resort Loop is a home located in Henry County.
Ownership History
Date
Name
Owned For
Owner Type
Purchase Details
Closed on
Jan 21, 2022
Sold by
Jones Sheldon L and Jones Glenda
Bought by
Deeley Michael and Ingrao Michael
Current Estimated Value
Home Financials for this Owner
Home Financials are based on the most recent Mortgage that was taken out on this home.
Original Mortgage
$1,800,000
Outstanding Balance
$1,439,912
Interest Rate
3.45%
Mortgage Type
New Conventional
Estimated Equity
-$298,412
Purchase Details
Closed on
Jan 1, 1979
Bought by
Jones Sheldon L
Create a Home Valuation Report for This Property
The Home Valuation Report is an in-depth analysis detailing your home's value as well as a comparison with similar homes in the area
Purchase History
| Date | Buyer | Sale Price | Title Company |
|---|---|---|---|
| Deeley Michael | $1,600,000 | Neese Law Firm | |
| Jones Sheldon L | -- | -- |
Source: Public Records
Mortgage History
| Date | Status | Borrower | Loan Amount |
|---|---|---|---|
| Open | Deeley Michael | $1,800,000 |
Source: Public Records
Tax History Compared to Growth
Tax History
| Year | Tax Paid | Tax Assessment Tax Assessment Total Assessment is a certain percentage of the fair market value that is determined by local assessors to be the total taxable value of land and additions on the property. | Land | Improvement |
|---|---|---|---|---|
| 2025 | $5,651 | $381,400 | $0 | $0 |
| 2024 | $5,651 | $292,320 | $200,000 | $92,320 |
| 2023 | $5,534 | $292,320 | $200,000 | $92,320 |
| 2022 | $5,534 | $292,320 | $200,000 | $92,320 |
| 2021 | $5,534 | $292,320 | $200,000 | $92,320 |
| 2020 | $5,534 | $292,320 | $200,000 | $92,320 |
| 2019 | $5,833 | $278,800 | $200,000 | $78,800 |
| 2018 | $5,833 | $278,800 | $200,000 | $78,800 |
| 2017 | $5,833 | $278,800 | $200,000 | $78,800 |
| 2016 | $5,749 | $278,800 | $200,000 | $78,800 |
| 2015 | $6,125 | $278,800 | $200,000 | $78,800 |
| 2014 | $5,276 | $278,800 | $200,000 | $78,800 |
| 2013 | $5,276 | $240,162 | $0 | $0 |
Source: Public Records
Map
Nearby Homes
- 1250 Cherry Island Rd
- 1224 Cherry Island Rd
- 47 Hideaway Cove
- 56 Hideaway Cove
- 246 Allen Dr
- 68 Hackberry Ln
- 2785 Cypress Rd
- 396 Shoreline Dr
- 0 Catfish Rd
- 00 Catfish Rd
- 408 Shoreline Dr
- 13 Cypress Harbor Ct
- 381 E Oak Dr
- 251 Otts Rd
- 000 Perch Dr
- 280 Poplar Dr
- 24 Crappie Dr
- 000 Meacham Dr
- 000 Ivy Dr Unit Lot 522, 523, 526, 5
- 1410 Kline Trail
- 130 Lakehill Rd
- 180 Lakehill Rd
- 105 Lakehill Rd
- 130 Dock Dr
- 155 Lakehill Rd
- 200 Lakehill Rd
- 90 Boat Dock Rd
- 1235 Cherry Island Rd
- 195 Lakehill Rd
- 1204 Cherry Island Rd
- 75 Boat Dock Rd
- 495 Hickory Dr
- 505 Hickory Dr
- 210 Lakehill Rd
- 475 Hickory Dr
- 145 Burns Rd
- 160 Burns Rd
- 1205 Cherry Island Rd
- 40 Boat Dock Rd
- 35 Boat Dock Rd
