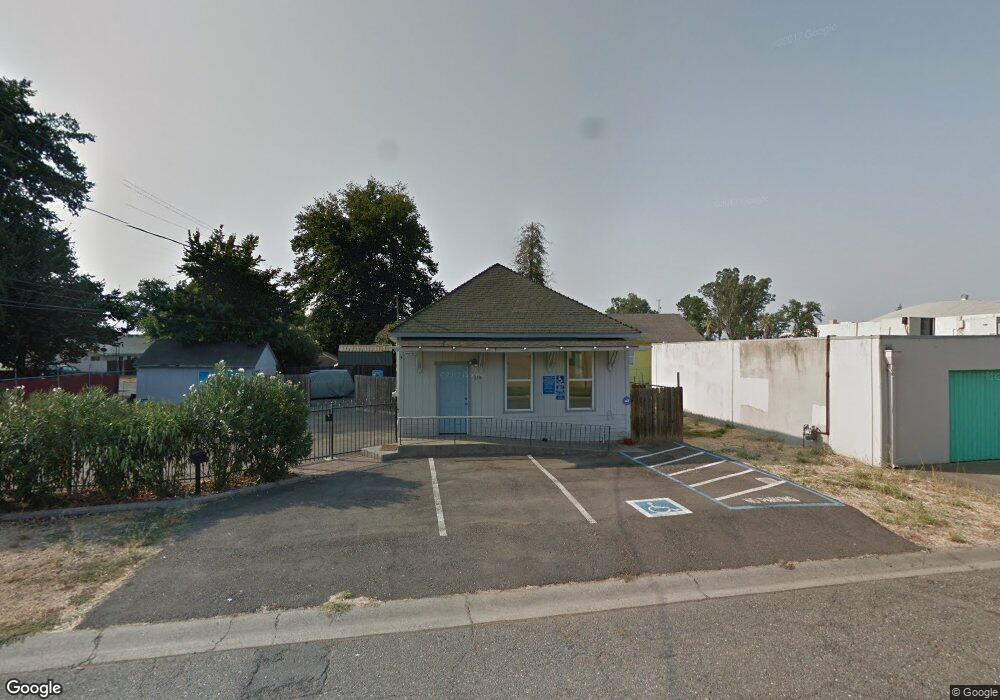
110 E 11th St Marysville, CA 95901
Estimated Value: $222,425
Studio
--
Bath
576
Sq Ft
$386/Sq Ft
Est. Value
About This Home
This home is located at 110 E 11th St, Marysville, CA 95901 and is currently estimated at $222,425, approximately $386 per square foot. 110 E 11th St is a home located in Yuba County with nearby schools including Kynoch Elementary School, Anna McKenney Intermediate, and Marysville High School.
Ownership History
Date
Name
Owned For
Owner Type
Purchase Details
Closed on
Apr 27, 2016
Sold by
Cable Gary
Bought by
Orey James Edward
Current Estimated Value
Purchase Details
Closed on
Apr 6, 2015
Sold by
Sanden Maria Teresa
Bought by
Cable Gary
Home Financials for this Owner
Home Financials are based on the most recent Mortgage that was taken out on this home.
Original Mortgage
$122,500
Interest Rate
3.76%
Mortgage Type
Seller Take Back
Purchase Details
Closed on
Jul 22, 2014
Sold by
Sanden Franz
Bought by
Sanden Franz S and The Franz S Sanden Trust
Purchase Details
Closed on
Sep 16, 2011
Sold by
Putman James G
Bought by
Sanden Franz and Sanden Maria Teresa
Create a Home Valuation Report for This Property
The Home Valuation Report is an in-depth analysis detailing your home's value as well as a comparison with similar homes in the area
Purchase History
| Date | Buyer | Sale Price | Title Company |
|---|---|---|---|
| Orey James Edward | $20,500 | First American Title Company | |
| Cable Gary | $124,500 | First American Title Company | |
| Sanden Franz S | -- | None Available | |
| Sanden Franz | $50,000 | Placer Title Company |
Source: Public Records
Mortgage History
| Date | Status | Borrower | Loan Amount |
|---|---|---|---|
| Previous Owner | Cable Gary | $122,500 |
Source: Public Records
Tax History
| Year | Tax Paid | Tax Assessment Tax Assessment Total Assessment is a certain percentage of the fair market value that is determined by local assessors to be the total taxable value of land and additions on the property. | Land | Improvement |
|---|---|---|---|---|
| 2025 | $2,205 | $167,501 | $35,511 | $131,990 |
| 2023 | $2,205 | $160,998 | $34,133 | $126,865 |
| 2022 | $2,462 | $157,842 | $33,464 | $124,378 |
| 2021 | $1,927 | $154,748 | $32,808 | $121,940 |
| 2020 | $2,417 | $153,162 | $32,472 | $120,690 |
| 2019 | $1,872 | $150,160 | $31,836 | $118,324 |
| 2018 | $1,838 | $147,216 | $31,212 | $116,004 |
| 2017 | $1,865 | $144,330 | $30,600 | $113,730 |
| 2016 | $1,879 | $126,398 | $30,457 | $95,941 |
| 2015 | $740 | $52,253 | $20,901 | $31,352 |
| 2014 | $729 | $51,230 | $20,492 | $30,738 |
Source: Public Records
Map
Nearby Homes
Your Personal Tour Guide
Ask me questions while you tour the home.