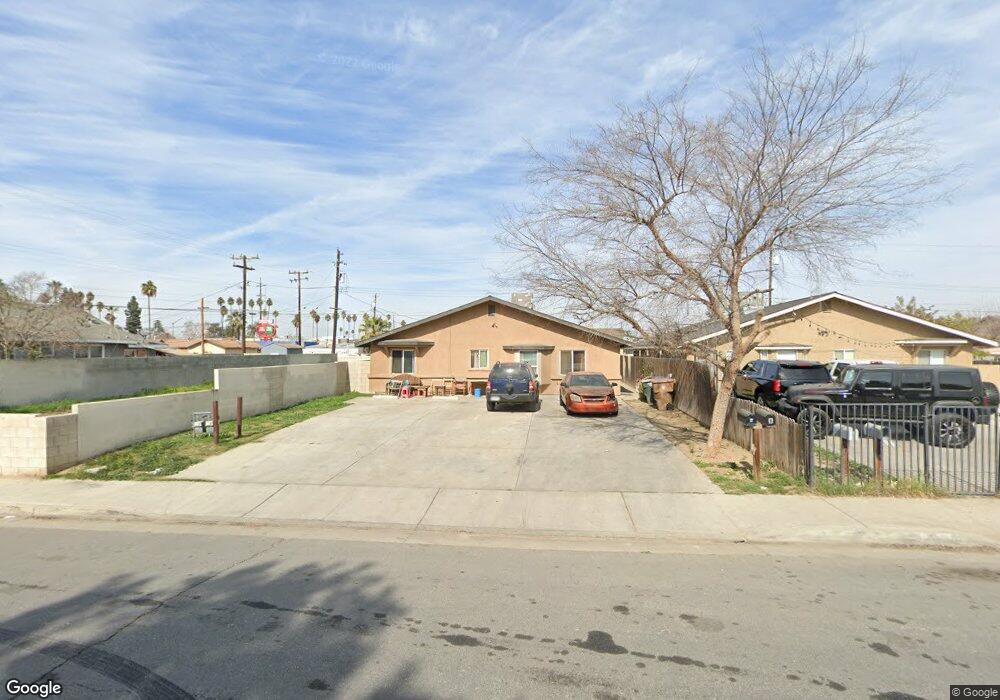
110 E 8th St Bakersfield, CA 93307
Lakeview NeighborhoodEstimated Value: $285,000 - $374,000
4
Beds
2
Baths
2,148
Sq Ft
$152/Sq Ft
Est. Value
About This Home
This home is located at 110 E 8th St, Bakersfield, CA 93307 and is currently estimated at $326,935, approximately $152 per square foot. 110 E 8th St is a home located in Kern County with nearby schools including Compton Junior High School, Bakersfield High School, and Our Lady Of Guadalupe.
Ownership History
Date
Name
Owned For
Owner Type
Purchase Details
Closed on
Feb 2, 2016
Sold by
Gonzales & Company Llc
Bought by
Bslm Llc
Current Estimated Value
Purchase Details
Closed on
Jun 2, 2015
Sold by
Family Lodging Investment Properties Llc
Bought by
Gonzalez & Co Llc
Purchase Details
Closed on
May 22, 2015
Sold by
Barroso Fabiola Martinez
Bought by
Family Lodging Investment Properties Llc
Purchase Details
Closed on
Mar 19, 2007
Sold by
Jara Brothers Investments Inc
Bought by
Barroso Fabiola Martinez
Home Financials for this Owner
Home Financials are based on the most recent Mortgage that was taken out on this home.
Original Mortgage
$360,000
Interest Rate
6.61%
Mortgage Type
Purchase Money Mortgage
Purchase Details
Closed on
Jul 25, 2006
Sold by
Munoz Marjorie A
Bought by
Jara Brothers Investments
Create a Home Valuation Report for This Property
The Home Valuation Report is an in-depth analysis detailing your home's value as well as a comparison with similar homes in the area
Home Values in the Area
Average Home Value in this Area
Purchase History
| Date | Buyer | Sale Price | Title Company |
|---|---|---|---|
| Bslm Llc | $174,000 | Chicago Title Company | |
| Gonzalez & Co Llc | $76,000 | Chicago Title Company | |
| Family Lodging Investment Properties Llc | $67,500 | None Available | |
| Barroso Fabiola Martinez | $400,000 | Alliance Title Company | |
| Jara Brothers Investments | $140,000 | Alliance Title Company |
Source: Public Records
Mortgage History
| Date | Status | Borrower | Loan Amount |
|---|---|---|---|
| Previous Owner | Barroso Fabiola Martinez | $360,000 |
Source: Public Records
Tax History
| Year | Tax Paid | Tax Assessment Tax Assessment Total Assessment is a certain percentage of the fair market value that is determined by local assessors to be the total taxable value of land and additions on the property. | Land | Improvement |
|---|---|---|---|---|
| 2025 | $3,613 | $205,973 | $35,511 | $170,462 |
| 2024 | $3,529 | $201,935 | $34,815 | $167,120 |
| 2023 | $3,529 | $197,977 | $34,133 | $163,844 |
| 2022 | $3,432 | $194,096 | $33,464 | $160,632 |
| 2021 | $3,236 | $190,291 | $32,808 | $157,483 |
| 2020 | $3,167 | $188,341 | $32,472 | $155,869 |
| 2019 | $3,106 | $188,341 | $32,472 | $155,869 |
| 2018 | $3,037 | $181,029 | $31,212 | $149,817 |
| 2017 | $3,017 | $177,480 | $30,600 | $146,880 |
| 2016 | $1,694 | $76,000 | $40,000 | $36,000 |
| 2015 | $2,187 | $120,000 | $20,000 | $100,000 |
| 2014 | -- | $107,400 | $21,480 | $85,920 |
Source: Public Records
Map
Nearby Homes
Your Personal Tour Guide
Ask me questions while you tour the home.