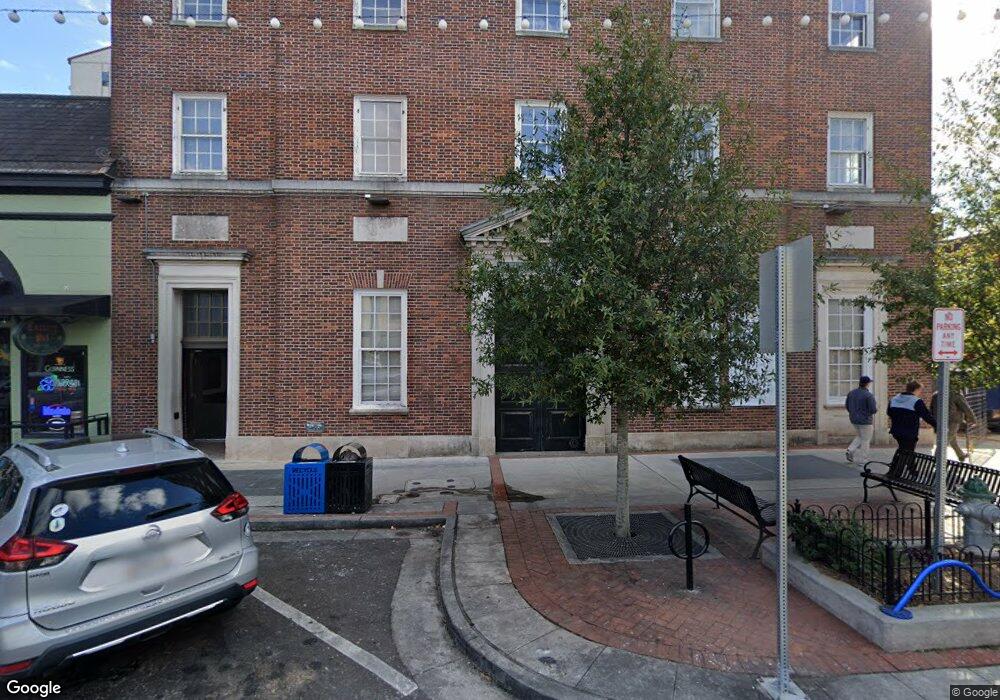
110 E Clayton St Unit 207 Athens, GA 30601
Estimated Value: $12,347,834
--
Bed
--
Bath
54,714
Sq Ft
$226/Sq Ft
Est. Value
About This Home
This home is located at 110 E Clayton St Unit 207, Athens, GA 30601 and is currently estimated at $12,347,834, approximately $225 per square foot. 110 E Clayton St Unit 207 is a home located in Clarke County with nearby schools including Barrow Elementary School, Clarke Middle School, and Clarke Central High School.
Ownership History
Date
Name
Owned For
Owner Type
Purchase Details
Closed on
Mar 17, 2022
Sold by
Tmcr One Llc
Bought by
110 E Clayton Street Llc
Current Estimated Value
Purchase Details
Closed on
May 31, 2018
Sold by
Humanism Investment Inc
Bought by
Tmcr One Llc
Home Financials for this Owner
Home Financials are based on the most recent Mortgage that was taken out on this home.
Original Mortgage
$5,362,500
Interest Rate
4.5%
Mortgage Type
Commercial
Purchase Details
Closed on
Sep 4, 1997
Sold by
Wei Hsu Min
Bought by
Humanism Investment Inc
Purchase Details
Closed on
Aug 29, 1997
Sold by
Clayton Street L L C
Bought by
Allen Properties Inc & Ricky H Chastain
Purchase Details
Closed on
Dec 16, 1996
Sold by
Allen Properties Inc
Bought by
Clayton Street L L C
Create a Home Valuation Report for This Property
The Home Valuation Report is an in-depth analysis detailing your home's value as well as a comparison with similar homes in the area
Home Values in the Area
Average Home Value in this Area
Purchase History
| Date | Buyer | Sale Price | Title Company |
|---|---|---|---|
| 110 E Clayton Street Llc | $9,350,000 | -- | |
| Tmcr One Llc | $8,000,000 | -- | |
| Humanism Investment Inc | -- | -- | |
| Allen Properties Inc & Ricky H Chastain | -- | -- | |
| Clayton Street L L C | -- | -- |
Source: Public Records
Mortgage History
| Date | Status | Borrower | Loan Amount |
|---|---|---|---|
| Previous Owner | Tmcr One Llc | $5,362,500 | |
| Previous Owner | Tmcr One Llc | $1,200,000 |
Source: Public Records
Tax History Compared to Growth
Tax History
| Year | Tax Paid | Tax Assessment Tax Assessment Total Assessment is a certain percentage of the fair market value that is determined by local assessors to be the total taxable value of land and additions on the property. | Land | Improvement |
|---|---|---|---|---|
| 2024 | $127,842 | $3,964,107 | $451,614 | $3,512,493 |
| 2023 | $127,842 | $3,958,530 | $410,558 | $3,547,972 |
| 2022 | $122,702 | $3,729,544 | $410,558 | $3,318,986 |
| 2021 | $113,533 | $3,271,848 | $361,682 | $2,910,166 |
| 2020 | $112,516 | $3,242,523 | $332,357 | $2,910,166 |
| 2019 | $109,330 | $3,128,187 | $332,357 | $2,795,830 |
| 2018 | $100,699 | $2,881,224 | $268,818 | $2,612,406 |
| 2017 | $95,945 | $2,745,207 | $268,818 | $2,476,389 |
| 2016 | $95,874 | $2,743,188 | $268,818 | $2,474,370 |
| 2015 | $89,631 | $2,560,894 | $250,896 | $2,309,997 |
| 2014 | $89,759 | $2,560,894 | $250,897 | $2,309,998 |
Source: Public Records
Map
Nearby Homes
- 269 N Hull St Unit 212
- 250 W Broad St Unit 811
- 250 W Broad St Unit 521
- 100 Prince Ave Unit A404
- 100 Prince Ave Unit A407
- 559 Pulaski St
- 143 Barrow St
- 600 Pulaski St
- 257 Hill St
- 365 S Church St Unit 1A, 1B, 1C
- 668 Pulaski St
- 570 Prince Ave
- 494 Baxter St Unit 32
- 145 Hendrix Ave
- 198 Flint St
- 500 Dearing St Unit 6
- 239 Madison Heights
- 178 First St
- 225 Oak St Unit 108
- 225 Oak St Unit 107
- 110 E Clayton St
- 159 W Clayton St
- 131 E Broad St Unit 603
- 131 E Broad St Unit 905
- 131 E Broad St Unit 508
- 131 E Broad St Unit 608
- 131 E Broad St Unit 504
- 131 E Broad St Unit 609
- 131 E Broad St Unit 906
- 131 E Broad St Unit 604
- 131 E Broad St Unit 501
- 131 E Broad St Unit 402
- 131 E Broad St Unit 708
- 131 E Broad St Unit 802
- 131 E Broad St Unit 606
- 131 E Broad St Unit 601
- 131 E Broad St Unit 307
- 131 E Broad St Unit 702
- 131 E Broad St Unit 306
- 131 E Broad St Unit 903