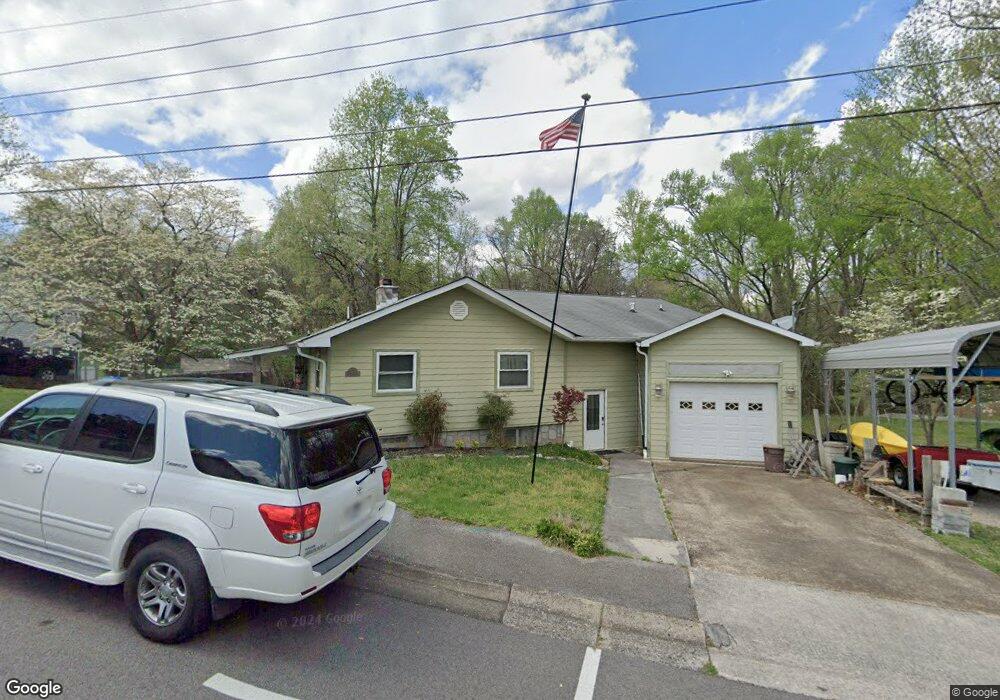
110 E Price Rd Oak Ridge, TN 37830
Estimated Value: $111,000 - $303,000
--
Bed
2
Baths
2,011
Sq Ft
$88/Sq Ft
Est. Value
About This Home
This home is located at 110 E Price Rd, Oak Ridge, TN 37830 and is currently estimated at $176,232, approximately $87 per square foot. 110 E Price Rd is a home located in Anderson County with nearby schools including Willow Brook Elementary, Robertsville Middle School, and Oak Ridge High School.
Ownership History
Date
Name
Owned For
Owner Type
Purchase Details
Closed on
Apr 25, 2025
Sold by
Vaneek Joan Eric and Vaneek Van Eek
Bought by
Vaneek Jonathan T and Vaneek Van Eek
Current Estimated Value
Home Financials for this Owner
Home Financials are based on the most recent Mortgage that was taken out on this home.
Original Mortgage
$92,600
Outstanding Balance
$91,298
Interest Rate
5.83%
Mortgage Type
New Conventional
Estimated Equity
$84,934
Purchase Details
Closed on
Jan 3, 2017
Sold by
Eek Cecelia Dawn Van and Eek Cecelia D Van
Bought by
Vaneek Joan E and Vaneek Van Eek
Home Financials for this Owner
Home Financials are based on the most recent Mortgage that was taken out on this home.
Original Mortgage
$132,000
Interest Rate
4.08%
Mortgage Type
New Conventional
Purchase Details
Closed on
Jul 12, 1999
Sold by
Muffelman Paula J
Bought by
Vaneek John E
Home Financials for this Owner
Home Financials are based on the most recent Mortgage that was taken out on this home.
Original Mortgage
$76,329
Interest Rate
7.43%
Purchase Details
Closed on
May 7, 1999
Bought by
Vaneek Joan E and Vaneek Wife Cecelia D
Purchase Details
Closed on
Dec 3, 1990
Bought by
Muffelman Paula J
Create a Home Valuation Report for This Property
The Home Valuation Report is an in-depth analysis detailing your home's value as well as a comparison with similar homes in the area
Home Values in the Area
Average Home Value in this Area
Purchase History
| Date | Buyer | Sale Price | Title Company |
|---|---|---|---|
| Vaneek Jonathan T | $109,000 | Admiral Title Inc | |
| Vaneek Joan E | -- | None Available | |
| Vaneek John E | $76,400 | -- | |
| Vaneek Joan E | $76,400 | -- | |
| Muffelman Paula J | $47,000 | -- |
Source: Public Records
Mortgage History
| Date | Status | Borrower | Loan Amount |
|---|---|---|---|
| Open | Vaneek Jonathan T | $92,600 | |
| Previous Owner | Vaneek Joan E | $132,000 | |
| Previous Owner | Muffelman Paula J | $76,329 |
Source: Public Records
Tax History Compared to Growth
Tax History
| Year | Tax Paid | Tax Assessment Tax Assessment Total Assessment is a certain percentage of the fair market value that is determined by local assessors to be the total taxable value of land and additions on the property. | Land | Improvement |
|---|---|---|---|---|
| 2024 | $1,040 | $42,325 | $9,400 | $32,925 |
| 2023 | $1,040 | $42,325 | $0 | $0 |
| 2022 | $2,019 | $42,325 | $9,400 | $32,925 |
| 2021 | $2,019 | $42,325 | $9,400 | $32,925 |
| 2020 | $1,837 | $42,325 | $9,400 | $32,925 |
| 2019 | $1,880 | $35,775 | $9,250 | $26,525 |
| 2018 | $1,837 | $35,775 | $9,250 | $26,525 |
| 2017 | $1,830 | $35,775 | $9,250 | $26,525 |
| 2016 | $1,830 | $35,775 | $9,250 | $26,525 |
| 2015 | -- | $35,775 | $9,250 | $26,525 |
| 2014 | -- | $35,775 | $9,250 | $26,525 |
| 2013 | -- | $35,650 | $0 | $0 |
Source: Public Records
Map
Nearby Homes
- 215 Outer Dr
- 113 Pomona Rd
- 641 Pennsylvania Ave
- 107 Underwood Rd
- 127 Westlook Cir
- 108 E Hunter Cir
- 380 W Outer Dr
- 183 Outer Dr
- 102 Nesper Rd
- 106 Nesper Rd
- 116 Hoyt Ln
- 240 W West Tennessee Ave
- 110 Malvern Rd
- 128 Orchard Ln
- 178 & 180 Hillside Rd
- 100 Viola Rd
- 118 Venus Rd
- 178180 Hillside Rd
- 121 Orchard Ln
- 111 W Magnolia Ln