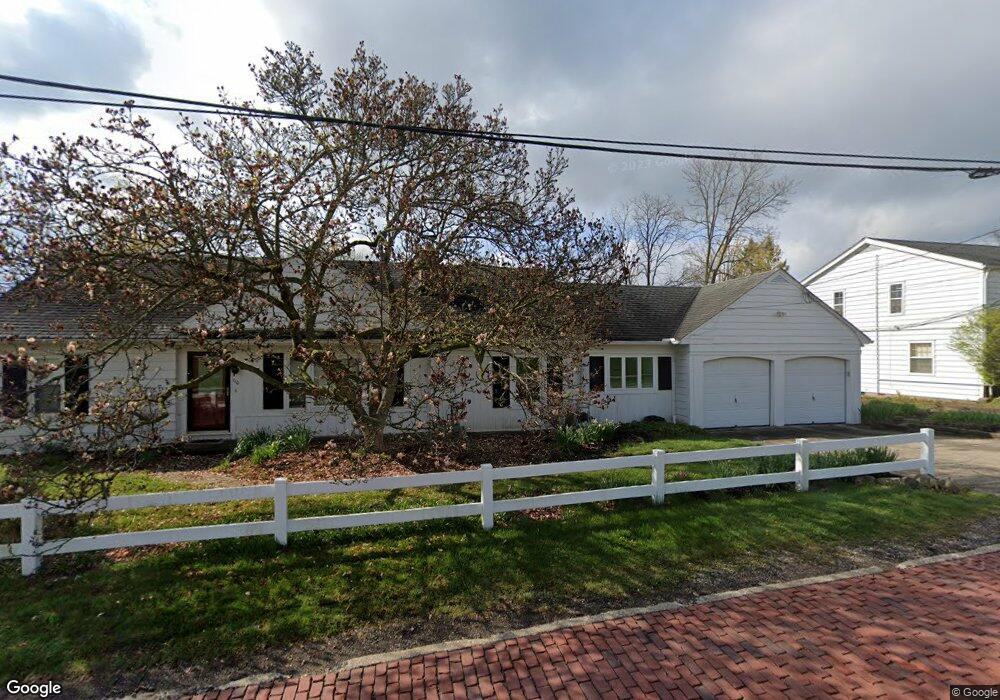
110 E Summit St Chagrin Falls, OH 44022
Estimated Value: $331,000 - $467,000
2
Beds
1
Bath
1,495
Sq Ft
$274/Sq Ft
Est. Value
About This Home
This home is located at 110 E Summit St, Chagrin Falls, OH 44022 and is currently estimated at $409,589, approximately $273 per square foot. 110 E Summit St is a home located in Cuyahoga County with nearby schools including Gurney Elementary School, Chagrin Falls Intermediate Elementary School, and Chagrin Falls Middle School.
Ownership History
Date
Name
Owned For
Owner Type
Purchase Details
Closed on
Nov 22, 2017
Sold by
Bets Jane E and Hoedt Kenneth C
Bought by
Hoedt Kenneth C and Betz Jane E
Current Estimated Value
Purchase Details
Closed on
Nov 30, 1994
Sold by
Wells Pauline
Bought by
Betz Jane E
Home Financials for this Owner
Home Financials are based on the most recent Mortgage that was taken out on this home.
Original Mortgage
$99,000
Interest Rate
8.91%
Mortgage Type
New Conventional
Purchase Details
Closed on
Jan 1, 1975
Bought by
Wells Pauline and Ruthella Jones
Create a Home Valuation Report for This Property
The Home Valuation Report is an in-depth analysis detailing your home's value as well as a comparison with similar homes in the area
Home Values in the Area
Average Home Value in this Area
Purchase History
| Date | Buyer | Sale Price | Title Company |
|---|---|---|---|
| Hoedt Kenneth C | $93,114,004 | None Available | |
| Betz Jane E | $132,000 | -- | |
| Wells Pauline | -- | -- |
Source: Public Records
Mortgage History
| Date | Status | Borrower | Loan Amount |
|---|---|---|---|
| Previous Owner | Betz Jane E | $99,000 |
Source: Public Records
Tax History
| Year | Tax Paid | Tax Assessment Tax Assessment Total Assessment is a certain percentage of the fair market value that is determined by local assessors to be the total taxable value of land and additions on the property. | Land | Improvement |
|---|---|---|---|---|
| 2025 | $6,311 | $103,530 | $26,040 | $77,490 |
| 2024 | $6,384 | $103,530 | $26,040 | $77,490 |
| 2023 | $6,644 | $93,350 | $23,980 | $69,370 |
| 2022 | $7,028 | $93,350 | $23,980 | $69,370 |
| 2021 | $6,997 | $93,350 | $23,980 | $69,370 |
| 2020 | $6,709 | $82,600 | $21,210 | $61,390 |
| 2019 | $6,607 | $236,000 | $60,600 | $175,400 |
| 2018 | $6,224 | $82,600 | $21,210 | $61,390 |
| 2017 | $6,536 | $77,740 | $19,920 | $57,820 |
| 2016 | $5,868 | $77,740 | $19,920 | $57,820 |
| 2015 | $5,429 | $77,740 | $19,920 | $57,820 |
| 2014 | $5,429 | $70,670 | $18,100 | $52,570 |
Source: Public Records
Map
Nearby Homes
- 42 W Orange St
- 110 Emilia Ct
- 106 W Washington St
- 118 Kenton Rd
- 26 Water St
- 449 N Main St
- 81 Hall St
- 207 S Main St
- 106 Solon Rd
- 213 S Main St
- 219 S Main St
- 40 Highland Ln
- 225 S Main St
- 0 Bell Rd
- 633 Coy Ln
- 275 Solon Rd Unit 275C
- 315 Solon Rd Unit 309
- 7650 Blackford Dr
- 7658 Blackford Dr
- 15813 Hemlock Rd
Your Personal Tour Guide
Ask me questions while you tour the home.