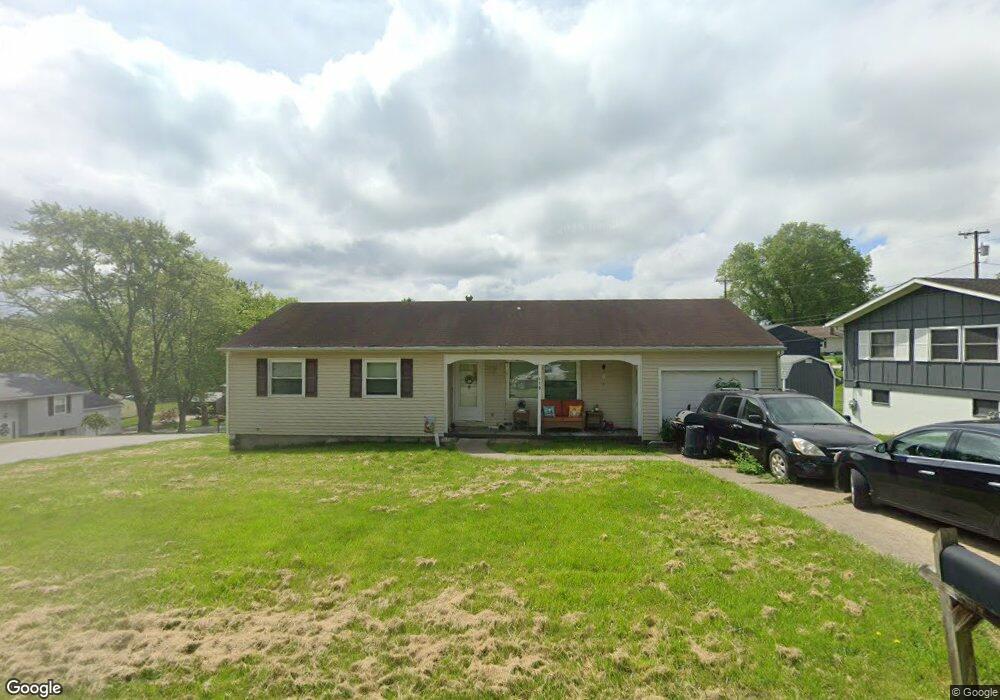
110 Elsie Dr Cambridge, OH 43725
Estimated Value: $166,085 - $217,000
--
Bed
1
Bath
1,054
Sq Ft
$182/Sq Ft
Est. Value
About This Home
This home is located at 110 Elsie Dr, Cambridge, OH 43725 and is currently estimated at $192,021, approximately $182 per square foot. 110 Elsie Dr is a home with nearby schools including Cambridge High School and St. Benedict Elementary School.
Ownership History
Date
Name
Owned For
Owner Type
Purchase Details
Closed on
Sep 21, 2012
Sold by
Advantage Bank
Bought by
Hershberger Terry and Hershberger Lisa M
Current Estimated Value
Home Financials for this Owner
Home Financials are based on the most recent Mortgage that was taken out on this home.
Original Mortgage
$53,100
Outstanding Balance
$9,040
Interest Rate
3.99%
Mortgage Type
Adjustable Rate Mortgage/ARM
Estimated Equity
$182,981
Purchase Details
Closed on
May 30, 2012
Sold by
Sowinski Frank R
Bought by
Advantag Bank
Create a Home Valuation Report for This Property
The Home Valuation Report is an in-depth analysis detailing your home's value as well as a comparison with similar homes in the area
Home Values in the Area
Average Home Value in this Area
Purchase History
| Date | Buyer | Sale Price | Title Company |
|---|---|---|---|
| Hershberger Terry | $59,000 | None Available | |
| Advantag Bank | $55,000 | None Available |
Source: Public Records
Mortgage History
| Date | Status | Borrower | Loan Amount |
|---|---|---|---|
| Open | Hershberger Terry | $53,100 |
Source: Public Records
Tax History Compared to Growth
Tax History
| Year | Tax Paid | Tax Assessment Tax Assessment Total Assessment is a certain percentage of the fair market value that is determined by local assessors to be the total taxable value of land and additions on the property. | Land | Improvement |
|---|---|---|---|---|
| 2024 | $2,176 | $43,803 | $11,134 | $32,669 |
| 2023 | $2,176 | $37,394 | $9,506 | $27,888 |
| 2022 | $1,894 | $37,400 | $9,520 | $27,880 |
| 2021 | $1,875 | $37,400 | $9,520 | $27,880 |
| 2020 | $1,739 | $34,160 | $8,490 | $25,670 |
| 2019 | $1,720 | $34,160 | $8,490 | $25,670 |
| 2018 | $1,554 | $34,160 | $8,490 | $25,670 |
| 2017 | $1,505 | $29,610 | $7,380 | $22,230 |
| 2016 | $1,492 | $29,610 | $7,380 | $22,230 |
| 2015 | $1,492 | $29,610 | $7,380 | $22,230 |
| 2014 | -- | $26,630 | $6,420 | $20,210 |
| 2013 | $675 | $26,630 | $6,420 | $20,210 |
Source: Public Records
Map
Nearby Homes