Estimated Value: $875,000 - $1,067,000
3
Beds
2
Baths
1,962
Sq Ft
$486/Sq Ft
Est. Value
About This Home
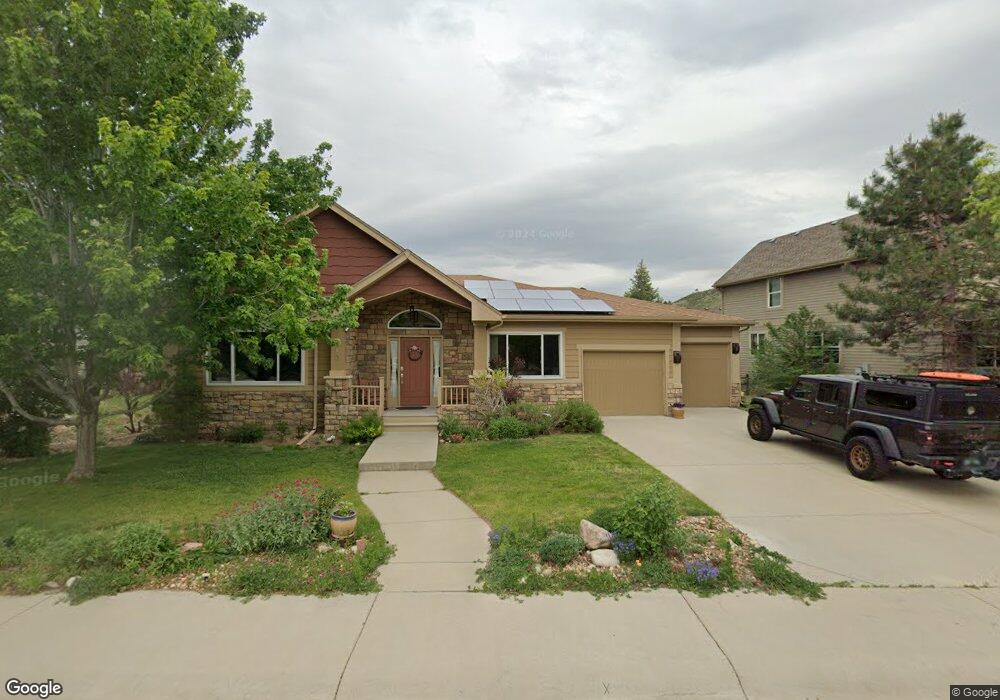
This home is located at 110 Estes Ct, Lyons, CO 80540 and is currently estimated at $953,041, approximately $485 per square foot. 110 Estes Ct is a home located in Boulder County with nearby schools including Lyons Elementary School and Lyons Middle/Senior High School.
Ownership History
Date
Name
Owned For
Owner Type
Purchase Details
Closed on
Jul 16, 2018
Sold by
Zilling Holly and Zilling John Eric
Bought by
Zilling John E
Current Estimated Value
Home Financials for this Owner
Home Financials are based on the most recent Mortgage that was taken out on this home.
Original Mortgage
$414,122
Outstanding Balance
$358,899
Interest Rate
4.5%
Mortgage Type
FHA
Estimated Equity
$594,142
Purchase Details
Closed on
Jun 16, 2005
Sold by
Barcewski Master Builders Inc
Bought by
Zilling Holly
Home Financials for this Owner
Home Financials are based on the most recent Mortgage that was taken out on this home.
Original Mortgage
$369,788
Interest Rate
7.6%
Mortgage Type
Unknown
Purchase Details
Closed on
May 27, 2005
Sold by
Barcewski Mary E
Bought by
Barcewski Master Builders Inc
Home Financials for this Owner
Home Financials are based on the most recent Mortgage that was taken out on this home.
Original Mortgage
$369,788
Interest Rate
7.6%
Mortgage Type
Unknown
Purchase Details
Closed on
Nov 21, 2002
Sold by
Barcewski Master Builders Inc
Bought by
Barcewski Mary E
Create a Home Valuation Report for This Property
The Home Valuation Report is an in-depth analysis detailing your home's value as well as a comparison with similar homes in the area
Purchase History
| Date | Buyer | Sale Price | Title Company |
|---|---|---|---|
| Zilling John E | -- | Cherry Creek Title Services | |
| Zilling Holly | $389,250 | -- | |
| Barcewski Master Builders Inc | -- | -- | |
| Barcewski Mary E | -- | -- |
Source: Public Records
Mortgage History
| Date | Status | Borrower | Loan Amount |
|---|---|---|---|
| Open | Zilling John E | $414,122 | |
| Closed | Zilling Holly | $369,788 |
Source: Public Records
Tax History
| Year | Tax Paid | Tax Assessment Tax Assessment Total Assessment is a certain percentage of the fair market value that is determined by local assessors to be the total taxable value of land and additions on the property. | Land | Improvement |
|---|---|---|---|---|
| 2025 | $6,601 | $54,138 | $3,969 | $50,169 |
| 2024 | $6,601 | $54,138 | $3,969 | $50,169 |
| 2023 | $6,512 | $55,510 | $3,692 | $55,503 |
| 2022 | $5,679 | $46,065 | $3,378 | $42,687 |
| 2021 | $5,611 | $47,390 | $3,475 | $43,915 |
| 2020 | $4,885 | $40,884 | $8,866 | $32,018 |
| 2019 | $4,788 | $40,884 | $8,866 | $32,018 |
| 2018 | $4,196 | $36,547 | $8,928 | $27,619 |
| 2017 | $4,127 | $40,405 | $9,870 | $30,535 |
| 2016 | $4,037 | $34,801 | $8,517 | $26,284 |
| 2015 | $3,838 | $30,598 | $4,617 | $25,981 |
| 2014 | $3,172 | $30,598 | $4,617 | $25,981 |
Source: Public Records
Map
Nearby Homes
- 104 Noland Ct
- 350 Mcconnell Dr
- 400 Carter Dr
- 334 Mcconnell Dr
- 430 Carter Dr
- 121 Osprey Ln
- 270 County Road 69
- 618 Overlook Dr
- 342 4th Ave
- 157 Stone Canyon Dr
- 240 Main St
- 245 High St
- 17667 Route 7
- 18673 Route 7
- 421 Stickney Ave
- 112 Longs Peak Dr
- 125 Longs Peak Dr
- 1040 5th Ave 2 and 4
- 1040 5th Ave 5
- 0 Apple Valley Rd
Your Personal Tour Guide
Ask me questions while you tour the home.