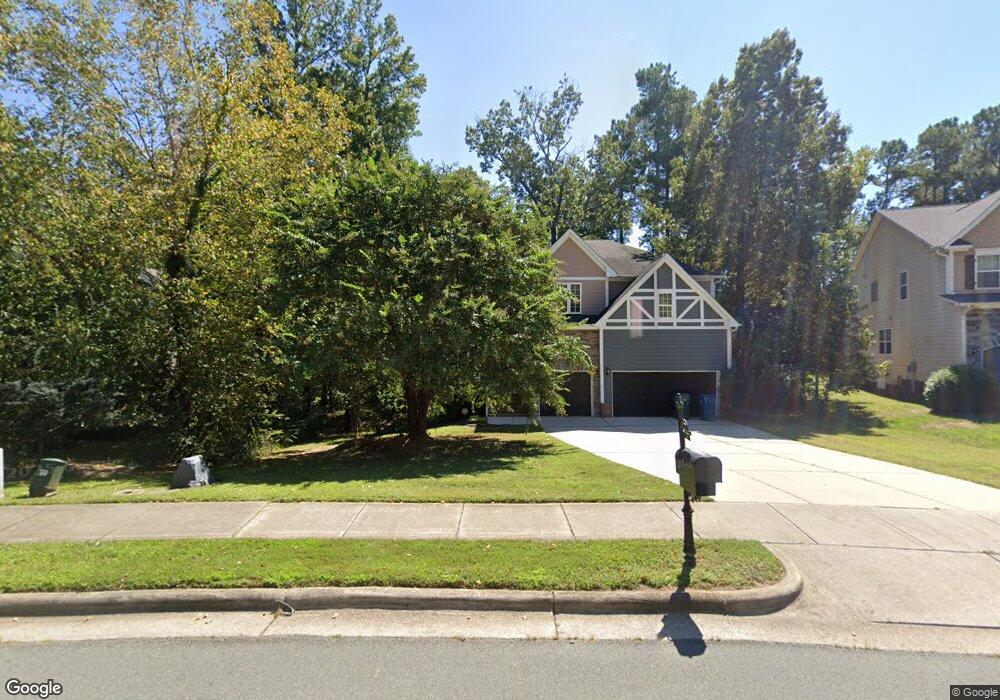
110 Few Cir Durham, NC 27705
Garrett NeighborhoodEstimated Value: $833,000 - $910,000
5
Beds
4
Baths
4,550
Sq Ft
$193/Sq Ft
Est. Value
About This Home
This home is located at 110 Few Cir, Durham, NC 27705 and is currently estimated at $878,516, approximately $193 per square foot. 110 Few Cir is a home located in Durham County with nearby schools including Morehead Montessori, Forest View Elementary, and Sherwood Githens Middle.
Ownership History
Date
Name
Owned For
Owner Type
Purchase Details
Closed on
Sep 13, 2022
Sold by
Karen Wexler
Bought by
Karen Wexler Revocable Trust
Current Estimated Value
Purchase Details
Closed on
Mar 6, 2015
Sold by
Christiana Trust
Bought by
Wexler Karen and Wexler Ira
Home Financials for this Owner
Home Financials are based on the most recent Mortgage that was taken out on this home.
Original Mortgage
$280,800
Interest Rate
3.77%
Mortgage Type
New Conventional
Purchase Details
Closed on
Jul 31, 2013
Sold by
Salley Victoria S
Bought by
Christina Trust
Purchase Details
Closed on
Mar 23, 2007
Sold by
D R Horton Inc
Bought by
Salley Victoria S
Home Financials for this Owner
Home Financials are based on the most recent Mortgage that was taken out on this home.
Original Mortgage
$351,252
Interest Rate
6.22%
Mortgage Type
Purchase Money Mortgage
Create a Home Valuation Report for This Property
The Home Valuation Report is an in-depth analysis detailing your home's value as well as a comparison with similar homes in the area
Home Values in the Area
Average Home Value in this Area
Purchase History
| Date | Buyer | Sale Price | Title Company |
|---|---|---|---|
| Karen Wexler Revocable Trust | -- | -- | |
| Wexler Karen | $351,000 | None Available | |
| Christina Trust | $471,447 | None Available | |
| Salley Victoria S | $439,500 | None Available |
Source: Public Records
Mortgage History
| Date | Status | Borrower | Loan Amount |
|---|---|---|---|
| Previous Owner | Wexler Karen | $280,800 | |
| Previous Owner | Salley Victoria S | $351,252 |
Source: Public Records
Tax History
| Year | Tax Paid | Tax Assessment Tax Assessment Total Assessment is a certain percentage of the fair market value that is determined by local assessors to be the total taxable value of land and additions on the property. | Land | Improvement |
|---|---|---|---|---|
| 2025 | $8,690 | $876,637 | $146,250 | $730,387 |
| 2024 | $6,586 | $472,138 | $84,565 | $387,573 |
| 2023 | $6,185 | $472,138 | $84,565 | $387,573 |
| 2022 | $6,043 | $472,138 | $84,565 | $387,573 |
| 2021 | $6,015 | $472,138 | $84,565 | $387,573 |
| 2020 | $5,873 | $472,138 | $84,565 | $387,573 |
| 2019 | $5,873 | $472,138 | $84,565 | $387,573 |
| 2018 | $4,946 | $364,639 | $71,555 | $293,084 |
| 2017 | $4,910 | $364,639 | $71,555 | $293,084 |
| 2016 | $4,744 | $436,577 | $71,555 | $365,022 |
| 2015 | $6,427 | $464,255 | $86,232 | $378,023 |
| 2014 | $7,138 | $515,648 | $86,077 | $429,571 |
Source: Public Records
Map
Nearby Homes
- 308 Few Cir
- 701 Harkness Cir
- 3608 Katie Ln
- 4 Biddle Ct
- 1 Bittern Ln
- 100 Pathwood Ln
- 4514 Erwin Rd
- 4316 Erwin Rd
- 3305 Waterbury Dr
- 3207 W Cornwallis Rd
- 3205 W Cornwallis Rd
- 103 Spring Blossom Ln
- 2803 Friendship Rd
- 113 Landsbury Dr
- 3112 Coachmans Way
- 3321 Coachmans Way
- 3305 Coachmans Way
- 3088 Colony Rd Unit 3088d
- 3088 Colony Rd Unit A
- 3080 Colony Rd Unit 3080c
- 108 Few Cir
- 112 Few Cir
- 301 Harkness Cir
- 207 Harkness Cir
- 106 Few Cir
- 303 Harkness Cir
- 205 Harkness Cir
- 305 Harkness Cir
- 203 Harkness Cir
- 104 Few Cir
- 202 Few Cir
- 201 Harkness Cir
- 3624 Henningson Way
- 102 Few Cir
- 401 Harkness Cir
- 105 Harkness Cir
- 204 Few Cir
- 304 Harkness Cir
- 306 Harkness Cir
- 405 Harkness Cir
Your Personal Tour Guide
Ask me questions while you tour the home.