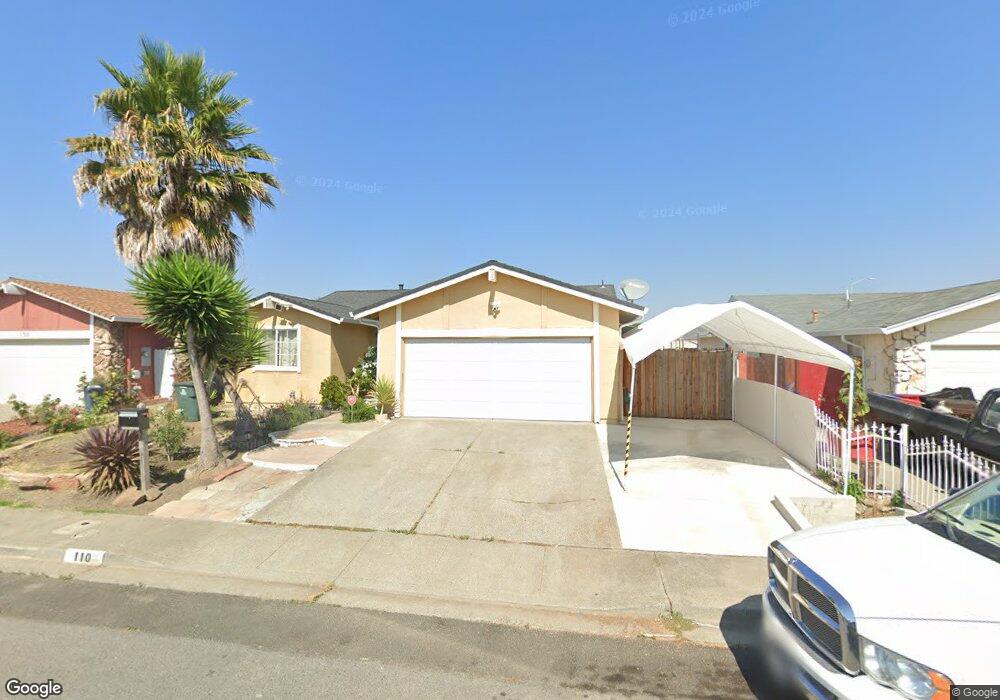
110 Fiddletown Ct Vallejo, CA 94589
North Vallejo NeighborhoodEstimated Value: $479,000 - $551,000
4
Beds
2
Baths
1,556
Sq Ft
$329/Sq Ft
Est. Value
About This Home
This home is located at 110 Fiddletown Ct, Vallejo, CA 94589 and is currently estimated at $511,601, approximately $328 per square foot. 110 Fiddletown Ct is a home located in Solano County with nearby schools including Dan Mini Elementary School, Solano Middle School, and Vallejo High School.
Ownership History
Date
Name
Owned For
Owner Type
Purchase Details
Closed on
May 23, 2021
Sold by
Anicete Lauro Manulit and Anicete Agnes David
Bought by
Lauro And Agnes Anicete 2021 Trust and Anicete
Current Estimated Value
Purchase Details
Closed on
Dec 1, 2011
Sold by
Manansala Francisco C and Manansala Yolanda V
Bought by
Anicete Agnes and Anicete Lauro
Purchase Details
Closed on
Oct 20, 2005
Sold by
Manansala Francisco C
Bought by
Manansala Francisco C and Manansala Yolanda
Home Financials for this Owner
Home Financials are based on the most recent Mortgage that was taken out on this home.
Original Mortgage
$96,000
Interest Rate
5.68%
Mortgage Type
Credit Line Revolving
Purchase Details
Closed on
Mar 23, 2005
Sold by
Manansala Francisco S and Manansala Pracita C
Bought by
Manansala Francisco
Home Financials for this Owner
Home Financials are based on the most recent Mortgage that was taken out on this home.
Original Mortgage
$336,000
Interest Rate
5.53%
Mortgage Type
Stand Alone First
Create a Home Valuation Report for This Property
The Home Valuation Report is an in-depth analysis detailing your home's value as well as a comparison with similar homes in the area
Home Values in the Area
Average Home Value in this Area
Purchase History
| Date | Buyer | Sale Price | Title Company |
|---|---|---|---|
| Lauro And Agnes Anicete 2021 Trust | -- | None Listed On Document | |
| Anicete Agnes | $120,000 | Westminster Title Company In | |
| Manansala Francisco C | -- | Chicago Title Co | |
| Manansala Francisco | $420,000 | Placer Title Co |
Source: Public Records
Mortgage History
| Date | Status | Borrower | Loan Amount |
|---|---|---|---|
| Previous Owner | Manansala Francisco C | $96,000 | |
| Previous Owner | Manansala Francisco | $336,000 |
Source: Public Records
Tax History Compared to Growth
Tax History
| Year | Tax Paid | Tax Assessment Tax Assessment Total Assessment is a certain percentage of the fair market value that is determined by local assessors to be the total taxable value of land and additions on the property. | Land | Improvement |
|---|---|---|---|---|
| 2025 | $2,801 | $150,715 | $62,797 | $87,918 |
| 2024 | $2,801 | $147,761 | $61,566 | $86,195 |
| 2023 | $2,602 | $144,864 | $60,359 | $84,505 |
| 2022 | $2,496 | $142,025 | $59,176 | $82,849 |
| 2021 | $2,439 | $139,241 | $58,016 | $81,225 |
| 2020 | $2,432 | $137,815 | $57,422 | $80,393 |
| 2019 | $2,341 | $135,114 | $56,297 | $78,817 |
| 2018 | $2,180 | $132,466 | $55,194 | $77,272 |
| 2017 | $2,272 | $129,869 | $54,112 | $75,757 |
| 2016 | $1,496 | $127,323 | $53,051 | $74,272 |
| 2015 | $1,477 | $125,412 | $52,255 | $73,157 |
| 2014 | $1,456 | $122,956 | $51,232 | $71,724 |
Source: Public Records
Map
Nearby Homes
- 149 Drytown Ct
- 115 Kilty Ct
- 121 Yankee Jim Ct
- 1634 Severus Dr
- 1863 Mini Dr
- 289 Catalina Way
- 160 Shari Ct
- 140 Boggs Ct
- 316 Meadows Dr
- 141 Albatrosse Way
- 205 Marla Dr
- 442 Northrup Ln
- 111 Spencer St
- 2041 Severus Dr
- 240 Rinaldo Dr
- 2117 Elliott Dr
- 177 Brophy St
- 121 Forsythia Ct
- 706 Capra Dr
- 485 Avalon Cir
- 130 Fiddletown Ct
- 100 Fiddletown Ct
- 1114 SW Fiddler Roof Glen
- 150 Fiddletown Ct
- 113 Pioneer Ct
- 125 Pioneer Ct
- 111 Fiddletown Ct
- 131 Fiddletown Ct
- 137 Pioneer Ct
- 101 Fiddletown Ct
- 151 Fiddletown Ct
- 105 Martel Ct
- 149 Pioneer Ct
- 190 Fiddletown Ct
- 171 Fiddletown Ct
- 196 Volcano Ct
- 191 Fiddletown Ct
- 188 Coloma Way
- 161 Pioneer Ct