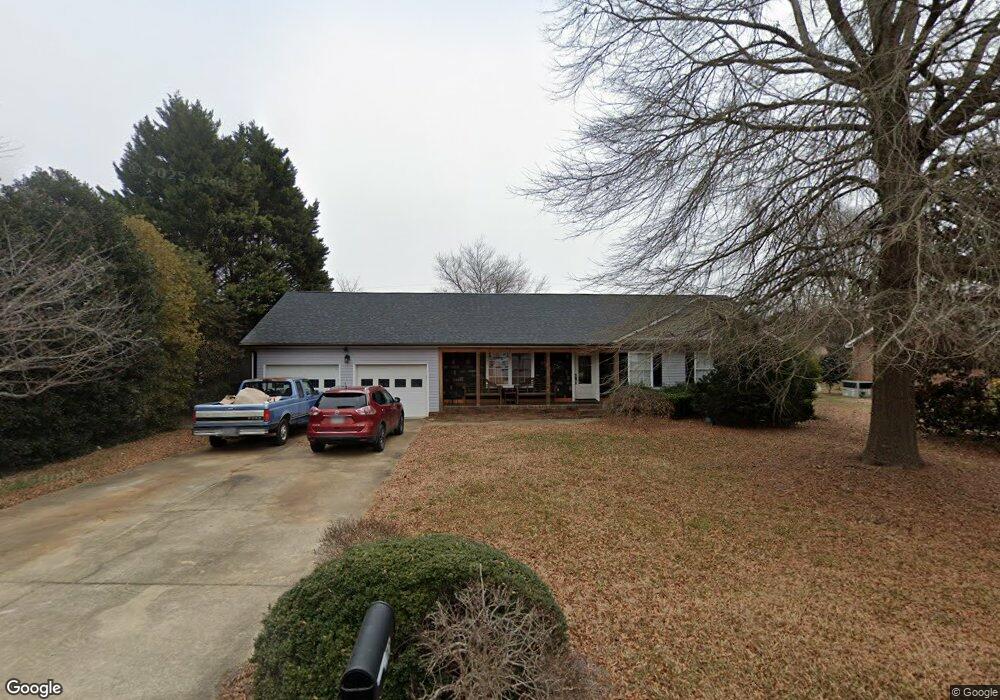
110 Fox Fire Run Gastonia, NC 28052
Estimated Value: $288,680 - $352,000
2
Beds
2
Baths
1,685
Sq Ft
$184/Sq Ft
Est. Value
About This Home
This home is located at 110 Fox Fire Run, Gastonia, NC 28052 and is currently estimated at $310,670, approximately $184 per square foot. 110 Fox Fire Run is a home located in Gaston County with nearby schools including Chapel Grove Elementary School, Southwest Middle School, and Hunter Huss High School.
Ownership History
Date
Name
Owned For
Owner Type
Purchase Details
Closed on
Jan 24, 2022
Sold by
Brandy Johnson
Bought by
Johnson Brandy and Johnson Frank
Current Estimated Value
Home Financials for this Owner
Home Financials are based on the most recent Mortgage that was taken out on this home.
Original Mortgage
$137,362
Outstanding Balance
$127,032
Interest Rate
3.22%
Mortgage Type
FHA
Estimated Equity
$183,638
Purchase Details
Closed on
Nov 9, 2001
Sold by
Helms Betty G and Helms Billy R
Bought by
Chaffee Brandy Kay
Purchase Details
Closed on
Aug 16, 2000
Sold by
Moose Henry J and Moose Anna L
Bought by
Helms Betty G
Home Financials for this Owner
Home Financials are based on the most recent Mortgage that was taken out on this home.
Original Mortgage
$89,500
Interest Rate
8.17%
Create a Home Valuation Report for This Property
The Home Valuation Report is an in-depth analysis detailing your home's value as well as a comparison with similar homes in the area
Home Values in the Area
Average Home Value in this Area
Purchase History
| Date | Buyer | Sale Price | Title Company |
|---|---|---|---|
| Johnson Brandy | $500 | Rosenberg Jay A | |
| Chaffee Brandy Kay | $103,500 | -- | |
| Helms Betty G | $115,000 | -- |
Source: Public Records
Mortgage History
| Date | Status | Borrower | Loan Amount |
|---|---|---|---|
| Open | Johnson Brandy | $137,362 | |
| Previous Owner | Helms Betty G | $89,500 | |
| Closed | Helms Betty G | $14,000 |
Source: Public Records
Tax History Compared to Growth
Tax History
| Year | Tax Paid | Tax Assessment Tax Assessment Total Assessment is a certain percentage of the fair market value that is determined by local assessors to be the total taxable value of land and additions on the property. | Land | Improvement |
|---|---|---|---|---|
| 2025 | $1,913 | $267,890 | $20,000 | $247,890 |
| 2024 | $1,913 | $267,890 | $20,000 | $247,890 |
| 2023 | $1,862 | $267,890 | $20,000 | $247,890 |
| 2022 | $1,557 | $169,230 | $18,000 | $151,230 |
| 2021 | $1,562 | $169,230 | $18,000 | $151,230 |
| 2019 | $1,579 | $169,230 | $18,000 | $151,230 |
| 2018 | $1,557 | $159,643 | $18,000 | $141,643 |
| 2017 | $1,557 | $159,643 | $18,000 | $141,643 |
| 2016 | $1,557 | $159,643 | $0 | $0 |
| 2014 | $1,430 | $148,164 | $22,500 | $125,664 |
Source: Public Records
Map
Nearby Homes
- 129 Hannaford Place
- 220 Lingerfelt Dr
- 226 Lingerfelt Dr
- 1041 Crowders Creek Rd
- 2300 Oakstone Cir
- 110 Jeran Ln
- 1014 Spring Dr
- 1500 Crowders Creek Rd
- 4841 Greenwood Dr
- 113 Lou Dr
- 4636 Merrywood Ln
- 608 Crowders Creek Rd
- 4606 Cloverwood Ln
- 416 Donna Ave
- 924 Ferguson Ridge Rd
- 107 Pecan Grove Cir Unit 11
- 129 Hunter Lee Ln
- 5909 Crawford Rd
- 335 S Fork Meadows Rd
- 1520 Woodend Ln
- 290 Fox Fire Run
- 1309 Crowders Creek Rd
- 114 Fox Fire Run
- 105 Fox Fire Run
- 113 Fox Fire Run
- 117 Fox Fire Run
- 122 Fox Fire Run
- 1245 Ferguson Ridge Rd
- 201 Fox Fire Run Unit 7 & P/6
- 201 Fox Fire Run
- 126 Fox Fire Run
- 205 Fox Fire Run
- 202 Fox Fire Run
- 125 Grissom Rd
- 1244 Ferguson Ridge Rd
- 0 Fox Fire Run
- 209 Fox Fire Run
- 210 Fox Fire Run
- 301 Fox Fire Run
- 1411 Crowders Creek Rd