Estimated Value: $541,000 - $599,000
4
Beds
3
Baths
2,226
Sq Ft
$255/Sq Ft
Est. Value
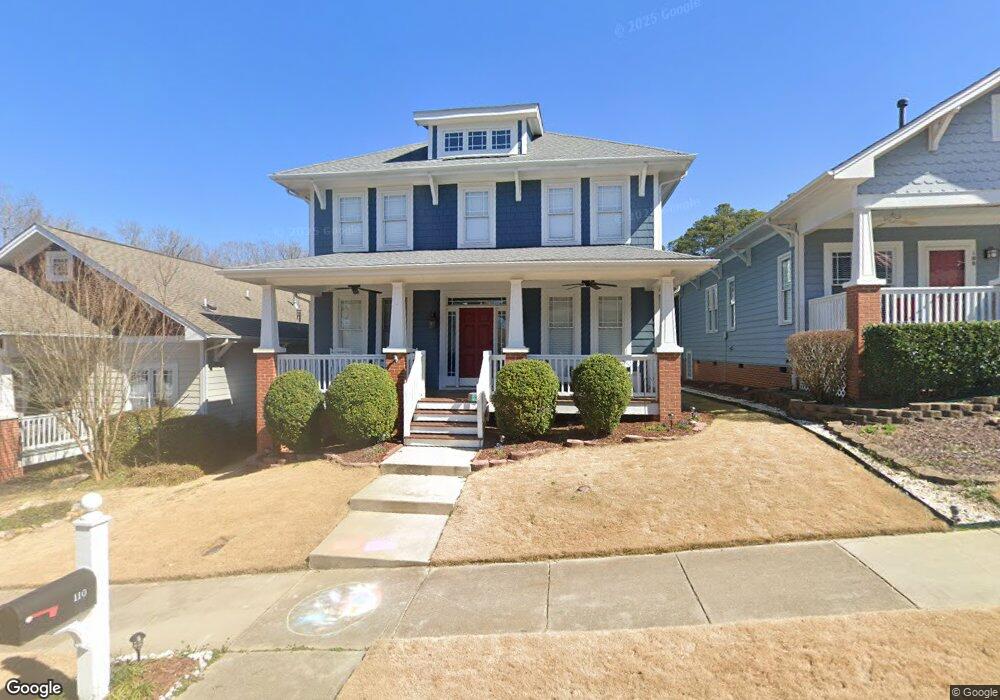
About This Home
This home is located at 110 Garden Side Way, Apex, NC 27502 and is currently estimated at $567,762, approximately $255 per square foot. 110 Garden Side Way is a home located in Wake County with nearby schools including Scotts Ridge Elementary School, Apex Middle, and Apex High School.
Ownership History
Date
Name
Owned For
Owner Type
Purchase Details
Closed on
Dec 6, 2004
Sold by
Preservation Homes Llc
Bought by
Maxie Duane R and Maxie Elisabeth K
Current Estimated Value
Home Financials for this Owner
Home Financials are based on the most recent Mortgage that was taken out on this home.
Original Mortgage
$185,600
Outstanding Balance
$91,957
Interest Rate
5.57%
Mortgage Type
Purchase Money Mortgage
Estimated Equity
$475,805
Purchase Details
Closed on
Oct 28, 2003
Sold by
Scotts Woods Llc
Bought by
Preservation Homes Llc
Home Financials for this Owner
Home Financials are based on the most recent Mortgage that was taken out on this home.
Original Mortgage
$152,000
Interest Rate
6.16%
Mortgage Type
Construction
Create a Home Valuation Report for This Property
The Home Valuation Report is an in-depth analysis detailing your home's value as well as a comparison with similar homes in the area
Purchase History
| Date | Buyer | Sale Price | Title Company |
|---|---|---|---|
| Maxie Duane R | $185,500 | -- | |
| Preservation Homes Llc | $38,000 | -- |
Source: Public Records
Mortgage History
| Date | Status | Borrower | Loan Amount |
|---|---|---|---|
| Open | Maxie Duane R | $185,600 | |
| Previous Owner | Preservation Homes Llc | $152,000 | |
| Closed | Maxie Duane R | $46,400 |
Source: Public Records
Tax History
| Year | Tax Paid | Tax Assessment Tax Assessment Total Assessment is a certain percentage of the fair market value that is determined by local assessors to be the total taxable value of land and additions on the property. | Land | Improvement |
|---|---|---|---|---|
| 2025 | $4,822 | $549,971 | $160,000 | $389,971 |
| 2024 | $4,714 | $549,971 | $160,000 | $389,971 |
Source: Public Records
Map
Nearby Homes
- 105 Garden Side Way
- 0 Jb Morgan Rd Unit 10051948
- 517 Village Loop Dr
- 400 Village Loop Dr
- 440 Oak Pine Dr
- 470 Magdala Place
- 1008 Daresbury Dr
- 1818 Porch Swing Way
- 101 Rocklyn Ln
- 1838 Woodall Crest Dr
- 1913 Metta Mill Ln
- 1006 Cherokee Sunset Rd
- 1866 Porch Swing Way
- 1224 Tartarian Trail
- 1880 Woodall Crest Dr
- 111 Lemon Drop Cir
- 107 Maple Crest Ct
- 120 Licorice Dr
- 102 Licorice Dr
- 203 Milky Way Dr
- 108 Garden Side Way
- 112 Garden Side Way
- 106 Garden Side Way
- 104 Garden Side Way
- 214 Homegate Cir
- 230 Garden Side Way
- 216 Homegate Cir
- 203 Homegate Cir
- 111 Garden Side Way
- 201 Homegate Cir
- 109 Garden Side Way
- 113 Garden Side Way
- 218 Homegate Cir
- 107 Garden Side Way
- 205 Homegate Cir
- 207 Homegate Cir
- 125 Homegate Cir
- 100 Garden Side Way
- 220 Homegate Cir
- 222 Homegate Cir
Your Personal Tour Guide
Ask me questions while you tour the home.