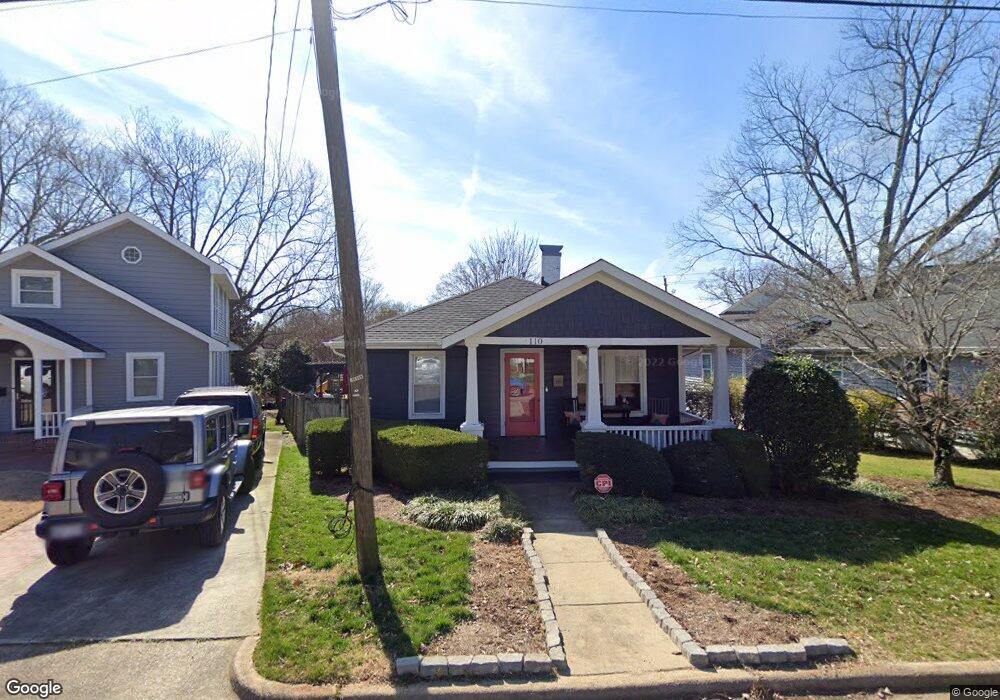
110 Georgetown Rd Raleigh, NC 27608
Five Points NeighborhoodEstimated Value: $781,000 - $870,000
3
Beds
2
Baths
1,244
Sq Ft
$676/Sq Ft
Est. Value
About This Home
This home is located at 110 Georgetown Rd, Raleigh, NC 27608 and is currently estimated at $840,488, approximately $675 per square foot. 110 Georgetown Rd is a home located in Wake County with nearby schools including Underwood Magnet Elementary School, Oberlin Middle School, and Broughton Magnet High School.
Ownership History
Date
Name
Owned For
Owner Type
Purchase Details
Closed on
Feb 15, 2013
Sold by
Ingram Michael Robert
Bought by
Ingram Michael Robert and Koury Sarah Ellen
Current Estimated Value
Purchase Details
Closed on
Dec 21, 2011
Sold by
Perkinson Ashley Matlock and Perkinson Sterling
Bought by
Ingram Michael Robert
Home Financials for this Owner
Home Financials are based on the most recent Mortgage that was taken out on this home.
Original Mortgage
$270,750
Outstanding Balance
$185,655
Interest Rate
4.06%
Mortgage Type
New Conventional
Estimated Equity
$654,833
Purchase Details
Closed on
Oct 31, 2007
Sold by
Poole Ashley Matlock and Perkinson Ashley Matlock
Bought by
Perkinson Ashley Matlock and Perkinson Robert Sterling
Purchase Details
Closed on
Jun 14, 2005
Sold by
Landi Helen E
Bought by
Poole Ashley Matlock
Home Financials for this Owner
Home Financials are based on the most recent Mortgage that was taken out on this home.
Original Mortgage
$239,200
Interest Rate
5.69%
Mortgage Type
Fannie Mae Freddie Mac
Purchase Details
Closed on
May 22, 1998
Sold by
Landi John Nicholas and Landi Mittie Crumpler
Bought by
Landi Helen E
Create a Home Valuation Report for This Property
The Home Valuation Report is an in-depth analysis detailing your home's value as well as a comparison with similar homes in the area
Home Values in the Area
Average Home Value in this Area
Purchase History
| Date | Buyer | Sale Price | Title Company |
|---|---|---|---|
| Ingram Michael Robert | -- | None Available | |
| Ingram Michael Robert | $285,000 | None Available | |
| Perkinson Ashley Matlock | -- | None Available | |
| Poole Ashley Matlock | $299,000 | -- | |
| Landi Helen E | -- | -- |
Source: Public Records
Mortgage History
| Date | Status | Borrower | Loan Amount |
|---|---|---|---|
| Open | Ingram Michael Robert | $270,750 | |
| Previous Owner | Poole Ashley Matlock | $239,200 | |
| Previous Owner | Poole Ashley Matlock | $59,800 |
Source: Public Records
Tax History
| Year | Tax Paid | Tax Assessment Tax Assessment Total Assessment is a certain percentage of the fair market value that is determined by local assessors to be the total taxable value of land and additions on the property. | Land | Improvement |
|---|---|---|---|---|
| 2025 | $7,022 | $802,886 | $530,000 | $272,886 |
| 2024 | $6,993 | $802,886 | $530,000 | $272,886 |
Source: Public Records
Map
Nearby Homes
- 1614 Carson St
- 202 Georgetown Rd
- 204 Georgetown Rd
- 1601 Sunrise Ave
- 214 Hudson St
- 1913 Reaves Dr
- 518 E Whitaker Mill Rd
- 1704 Bickett Blvd
- 1523 Sunrise Ave
- 1521 1/2 Sunrise Ave
- 1521 Havenmont Ct
- 1527 Urban Trace Ln
- 1521 Sunrise Ave
- 1525 Urban Trace Ln
- 1610 Draper View Loop Unit 101
- 401 Bryan Pointe Dr Unit 103
- 1523 Urban Trace Ln
- 1523 Havenmont Ct
- 1525 Havenmont Ct
- 1533 Urban Trace Ln
- 108 Georgetown Rd
- 112 Georgetown Rd
- 114 Georgetown Rd
- 1834 Reaves Dr
- 116 Georgetown Rd
- 111 Georgetown Rd
- 1802 Reaves Dr
- 1825 Reaves Dr
- 1821 Reaves Dr
- 1829 Reaves Dr
- 1817 Reaves Dr
- 120 Georgetown Rd
- 1833 Reaves Dr
- 115 Georgetown Rd
- 113 Georgetown Rd
- 1813 Reaves Dr
- 119 Georgetown Rd
- 1837 Reaves Dr
- 1800 Reaves Dr
- 1809 Reaves Dr
Your Personal Tour Guide
Ask me questions while you tour the home.