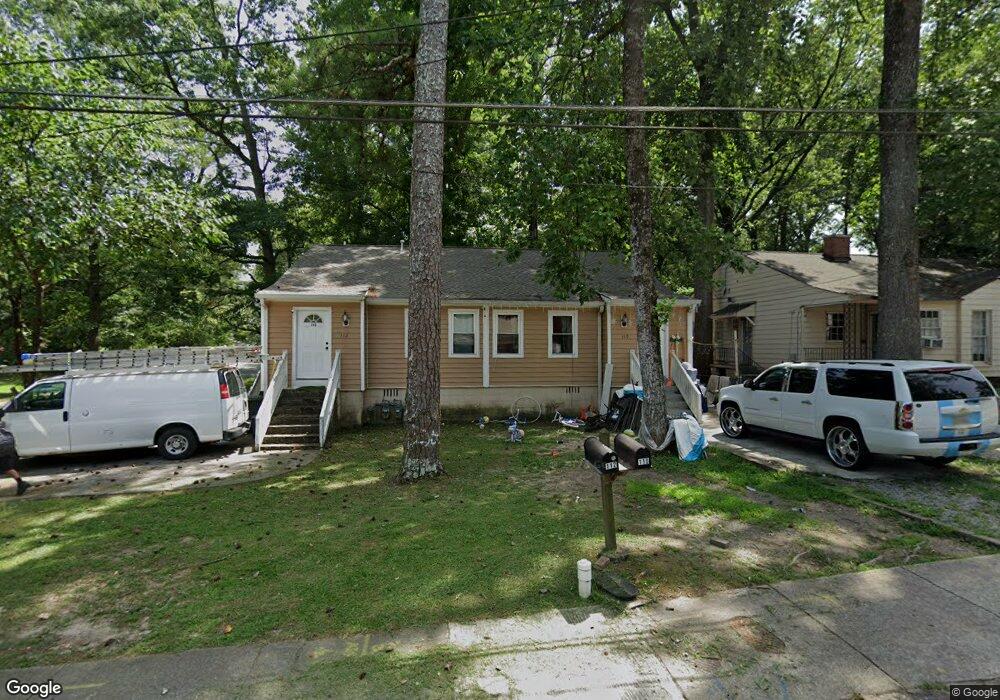
110 Gramling St SE Unit 112 Marietta, GA 30008
Dixie NeighborhoodEstimated Value: $305,000 - $364,000
4
Beds
2
Baths
1,713
Sq Ft
$198/Sq Ft
Est. Value
About This Home
This home is located at 110 Gramling St SE Unit 112, Marietta, GA 30008 and is currently estimated at $339,819, approximately $198 per square foot. 110 Gramling St SE Unit 112 is a home located in Cobb County with nearby schools including Hickory Hills Elementary School, Marietta Sixth Grade Academy, and Marietta Middle School.
Ownership History
Date
Name
Owned For
Owner Type
Purchase Details
Closed on
Jul 10, 2024
Sold by
Chamorro Alberto
Bought by
Anna110 Joh Llc
Current Estimated Value
Purchase Details
Closed on
Oct 1, 2010
Sold by
Bishop R Lamar and Bishop Emily E
Bought by
Chamorro Alberto
Home Financials for this Owner
Home Financials are based on the most recent Mortgage that was taken out on this home.
Original Mortgage
$35,000
Interest Rate
4.36%
Mortgage Type
Trade
Create a Home Valuation Report for This Property
The Home Valuation Report is an in-depth analysis detailing your home's value as well as a comparison with similar homes in the area
Home Values in the Area
Average Home Value in this Area
Purchase History
| Date | Buyer | Sale Price | Title Company |
|---|---|---|---|
| Anna110 Joh Llc | -- | None Listed On Document | |
| Chamorro Alberto | $35,000 | -- |
Source: Public Records
Mortgage History
| Date | Status | Borrower | Loan Amount |
|---|---|---|---|
| Previous Owner | Chamorro Alberto | $35,000 |
Source: Public Records
Tax History Compared to Growth
Tax History
| Year | Tax Paid | Tax Assessment Tax Assessment Total Assessment is a certain percentage of the fair market value that is determined by local assessors to be the total taxable value of land and additions on the property. | Land | Improvement |
|---|---|---|---|---|
| 2025 | $1,097 | $129,636 | $56,000 | $73,636 |
| 2024 | $1,156 | $136,696 | $52,000 | $84,696 |
| 2023 | $724 | $85,572 | $39,600 | $45,972 |
| 2022 | $715 | $84,524 | $39,600 | $44,924 |
| 2021 | $536 | $62,360 | $39,600 | $22,760 |
| 2020 | $357 | $41,540 | $13,000 | $28,540 |
| 2019 | $334 | $38,892 | $12,000 | $26,892 |
| 2018 | $309 | $36,016 | $12,000 | $24,016 |
| 2017 | $234 | $34,016 | $10,000 | $24,016 |
| 2016 | $221 | $32,016 | $8,000 | $24,016 |
| 2015 | $190 | $25,396 | $4,000 | $21,396 |
| 2014 | $109 | $14,000 | $0 | $0 |
Source: Public Records
Map
Nearby Homes
- 88 Garrison Rd SE
- 584 Bright St
- 533 Coral St
- 607 Pecan Knoll Dr Unit 14
- 626 Pecan Knoll Dr Unit 13
- 300 Senna St
- 313 Senna St
- 557 Henry Dr
- 99 Griggs St SW
- 233 Scottsdale Dr
- 355 Niles Ct Unit 2
- 301 Niles Ct Unit 5
- 266 Crescent Cir SW
- 188 Summit Ave SE
- 184 Summit Ave SE
- 307 Green St SE
- 408 Silverbell Way
- 73 Whitlock Square SW
- 180 Easy Pines Way
- 25 Whitlock Square SW
- 102 Gramling St SE
- 100 Gramling St SE Unit 102
- 94 Gramling St SE
- 120 Gramling St SE
- 107 Gramling St SE Unit 109
- 115 Gramling St SE
- 88 Gramling St SE Unit 90
- 528 Bolan St SE
- 97 Gramling St SE Unit 99
- 136 Gramling St SE Unit 138
- 136 Gramling St SE
- 91 Gramling St SE Unit 93
- 91 Gramling St SE
- 80 Gramling St SE Unit 82
- 85 Gramling St SE Unit 87
- 538 Bolan St SE
- 74 Gramling St SE Unit 76
- 77 Gramling St SE
- 529 Bolan St SE
- 144 Gramling St SE