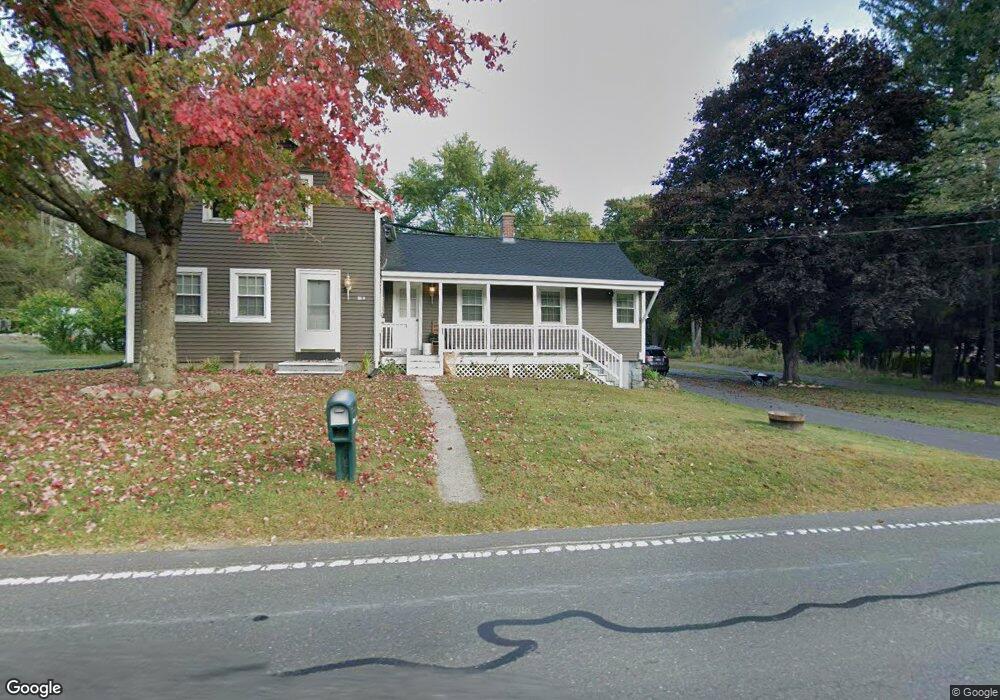
110 Hendrick St Easthampton, MA 01027
Estimated Value: $294,000 - $326,000
4
Beds
2
Baths
1,828
Sq Ft
$172/Sq Ft
Est. Value
About This Home
This home is located at 110 Hendrick St, Easthampton, MA 01027 and is currently estimated at $314,133, approximately $171 per square foot. 110 Hendrick St is a home located in Hampshire County with nearby schools including Easthampton High School, Tri-County Schools, and New England Adolescent Research Institute.
Ownership History
Date
Name
Owned For
Owner Type
Purchase Details
Closed on
Aug 27, 2021
Sold by
Glidden Mark A
Bought by
Williams Jillian
Current Estimated Value
Home Financials for this Owner
Home Financials are based on the most recent Mortgage that was taken out on this home.
Original Mortgage
$237,500
Outstanding Balance
$216,107
Interest Rate
2.8%
Mortgage Type
Purchase Money Mortgage
Estimated Equity
$98,026
Purchase Details
Closed on
Aug 31, 2005
Sold by
Besko Edward R
Bought by
Glidden Mark A
Home Financials for this Owner
Home Financials are based on the most recent Mortgage that was taken out on this home.
Original Mortgage
$170,050
Interest Rate
5.81%
Mortgage Type
Purchase Money Mortgage
Create a Home Valuation Report for This Property
The Home Valuation Report is an in-depth analysis detailing your home's value as well as a comparison with similar homes in the area
Home Values in the Area
Average Home Value in this Area
Purchase History
| Date | Buyer | Sale Price | Title Company |
|---|---|---|---|
| Williams Jillian | $250,000 | None Available | |
| Glidden Mark A | $179,000 | -- |
Source: Public Records
Mortgage History
| Date | Status | Borrower | Loan Amount |
|---|---|---|---|
| Open | Williams Jillian | $237,500 | |
| Previous Owner | Glidden Mark A | $170,050 |
Source: Public Records
Tax History
| Year | Tax Paid | Tax Assessment Tax Assessment Total Assessment is a certain percentage of the fair market value that is determined by local assessors to be the total taxable value of land and additions on the property. | Land | Improvement |
|---|---|---|---|---|
| 2025 | $3,870 | $283,100 | $110,400 | $172,700 |
| 2024 | $3,736 | $275,500 | $107,300 | $168,200 |
| 2023 | $2,861 | $195,300 | $84,700 | $110,600 |
| 2022 | $3,228 | $195,300 | $84,700 | $110,600 |
| 2021 | $3,701 | $200,800 | $84,700 | $116,100 |
| 2020 | $3,469 | $195,300 | $84,700 | $110,600 |
| 2019 | $2,865 | $185,300 | $84,700 | $100,600 |
| 2018 | $2,765 | $172,800 | $79,900 | $92,900 |
| 2017 | $2,696 | $166,300 | $76,700 | $89,600 |
| 2016 | $2,384 | $152,900 | $76,700 | $76,200 |
| 2015 | $2,316 | $152,900 | $76,700 | $76,200 |
Source: Public Records
Map
Nearby Homes
Your Personal Tour Guide
Ask me questions while you tour the home.