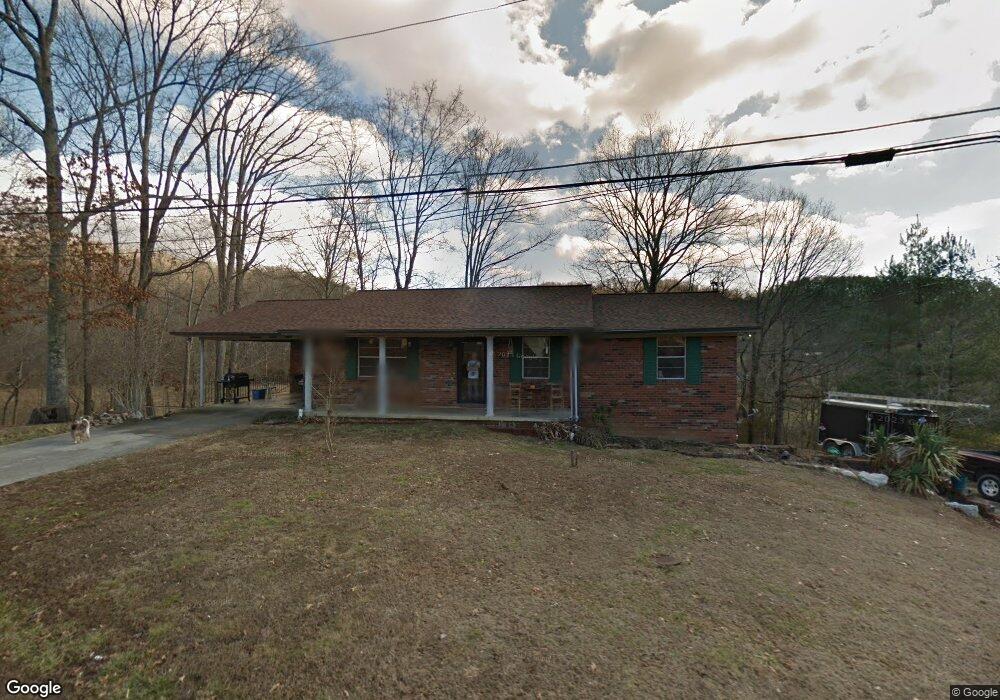
110 Hill Acre Rd Maynardville, TN 37807
Paulette NeighborhoodEstimated Value: $257,000 - $313,000
3
Beds
2
Baths
1,904
Sq Ft
$151/Sq Ft
Est. Value
About This Home
This home is located at 110 Hill Acre Rd, Maynardville, TN 37807 and is currently estimated at $288,398, approximately $151 per square foot. 110 Hill Acre Rd is a home located in Union County with nearby schools including Paulette Elementary School, Union County High School, and H Maynard Middle School.
Ownership History
Date
Name
Owned For
Owner Type
Purchase Details
Closed on
Nov 16, 2018
Sold by
Doran Dolph
Bought by
Wells Brody A and Wells Kristin L
Current Estimated Value
Purchase Details
Closed on
Jul 13, 2018
Sold by
Risinger Donald Louis and Risinger Kayla Deanna
Bought by
Dolph Doran
Purchase Details
Closed on
Jun 15, 2010
Sold by
Federal National Mortgage Association
Bought by
Risinger Donald L
Purchase Details
Closed on
Oct 16, 2009
Sold by
Sands Johnny J
Bought by
Federal National Mtg Associati
Purchase Details
Closed on
Nov 17, 2006
Sold by
Gerald Prutsman
Bought by
Sands Johnny J
Purchase Details
Closed on
Mar 5, 1999
Sold by
Franklin Sexton Jimmy
Bought by
Gerald Prutsman
Purchase Details
Closed on
Nov 9, 1981
Bought by
Sexton Jimmy Franklin
Create a Home Valuation Report for This Property
The Home Valuation Report is an in-depth analysis detailing your home's value as well as a comparison with similar homes in the area
Home Values in the Area
Average Home Value in this Area
Purchase History
| Date | Buyer | Sale Price | Title Company |
|---|---|---|---|
| Wells Brody A | $166,000 | Superior Title & Escrow Llc | |
| Wells Brody A | $166,000 | Superior Title & Escrow Llc | |
| Dolph Doran | $60,301 | None Available | |
| Dolph Doran | $60,301 | None Available | |
| Risinger Donald L | $69,000 | -- | |
| Risinger Donald L | $69,000 | -- | |
| Federal National Mtg Associati | $140,785 | -- | |
| Federal National Mtg Associati | $140,785 | -- | |
| Sands Johnny J | $123,000 | -- | |
| Sands Johnny J | $123,000 | -- | |
| Gerald Prutsman | $80,000 | -- | |
| Gerald Prutsman | $80,000 | -- | |
| Sexton Jimmy Franklin | -- | -- | |
| Sexton Jimmy Franklin | -- | -- |
Source: Public Records
Tax History Compared to Growth
Tax History
| Year | Tax Paid | Tax Assessment Tax Assessment Total Assessment is a certain percentage of the fair market value that is determined by local assessors to be the total taxable value of land and additions on the property. | Land | Improvement |
|---|---|---|---|---|
| 2024 | $873 | $45,975 | $6,250 | $39,725 |
| 2023 | $873 | $45,975 | $6,250 | $39,725 |
| 2022 | $731 | $45,975 | $6,250 | $39,725 |
| 2021 | $592 | $27,675 | $2,850 | $24,825 |
| 2020 | $592 | $27,675 | $2,850 | $24,825 |
| 2019 | $592 | $27,675 | $2,850 | $24,825 |
| 2018 | $592 | $27,675 | $2,850 | $24,825 |
| 2017 | $592 | $27,675 | $2,850 | $24,825 |
| 2016 | $533 | $24,550 | $2,450 | $22,100 |
| 2015 | $533 | $24,550 | $2,450 | $22,100 |
| 2014 | $439 | $24,541 | $0 | $0 |
Source: Public Records
Map
Nearby Homes
- 112 Dogwood St
- L-7 Williams Dr
- 275 Dogwood Ln
- 213 Brock Rd
- 254 Dogwood Ln
- 215 Jamie St
- 211 Jamie St
- 375 Russell Dr
- 323 Maynardville Hwy
- 9211 Brock Rd
- 9210 Brock Rd
- 7725 Texas Valley Rd
- 9024 Welch Rd
- 0 Satterfield Rd Unit 1313221
- 589 Possum Valley Rd
- 8210 Wood Rd
- 9502 Old Loyston Rd
- 00 Old Tazewell Pike
- 250 Burkhart Rd
- 3717 Hickory Valley Rd
- 115 Hill Acre Rd
- 114 Hill Acre Rd
- 105 Hill Acre Rd
- 118 Hill Acre Rd
- 1086 Beard Valley Rd
- 1120 Beard Valley Rd
- 122 Hill Acre Rd
- 1093 Beard Valley Rd
- 1083 Beard Valley Rd
- 289 Old Maynardville Hwy W
- 281 Old Maynardville Hwy W
- 1115 Beard Valley Rd
- 1115 Beard Valley Rd Unit 3
- 1414 Maynardville Hwy
- 1339 Maynardville Hwy
- 1409 Maynardville Hwy
- 1421 Maynardville Hwy
- 1052 Beard Valley Rd
- 1505 Maynardville Hwy
- 225 Old Maynardville Hwy W