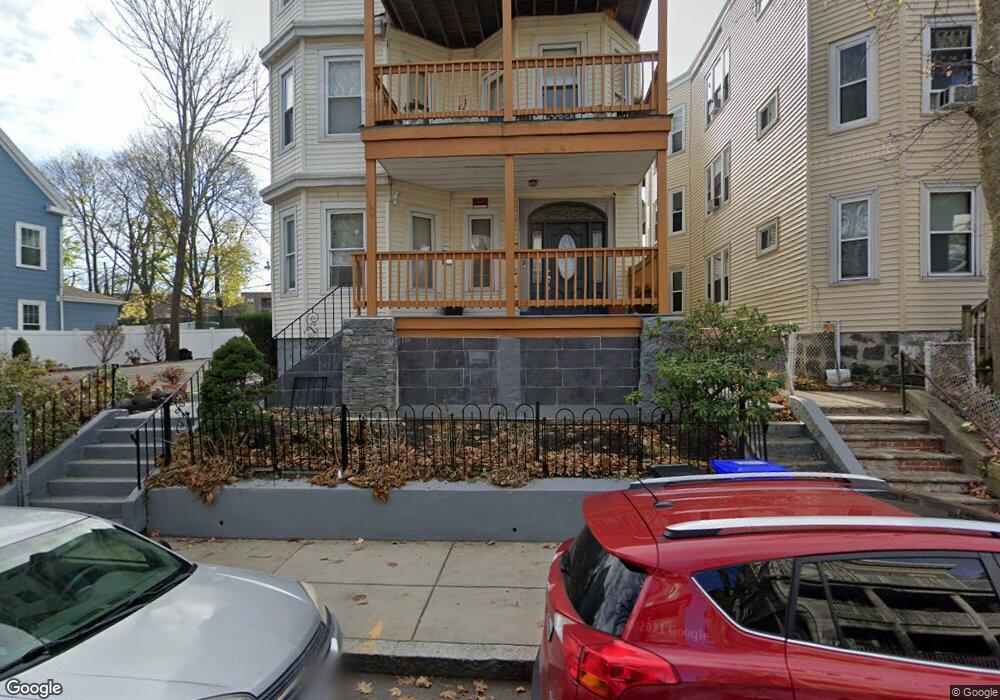
110 Howland St Boston, MA 02121
Washington Park NeighborhoodEstimated Value: $859,000 - $1,344,893
12
Beds
3
Baths
4,650
Sq Ft
$244/Sq Ft
Est. Value
About This Home
This home is located at 110 Howland St, Boston, MA 02121 and is currently estimated at $1,134,473, approximately $243 per square foot. 110 Howland St is a home located in Suffolk County with nearby schools including Bridge Boston Charter School and Mother Caroline Academy & Education Center.
Ownership History
Date
Name
Owned For
Owner Type
Purchase Details
Closed on
Sep 28, 2021
Sold by
Graves Mary and Graves Eugene
Bought by
Howland Pleasant Gmf Llc
Current Estimated Value
Purchase Details
Closed on
Dec 21, 1995
Sold by
Howland St Rt 110
Bought by
Graves Mary and Graves Eugene
Purchase Details
Closed on
Jan 10, 1995
Sold by
Citicorp Mtg Inc
Bought by
Howland St Rt
Purchase Details
Closed on
Aug 23, 1994
Sold by
Mcadam Judith A and Citicorp Mtg Inc
Bought by
Citicorp Mtg Inc
Purchase Details
Closed on
Jan 31, 1990
Sold by
Delaney Martha M
Bought by
Mcadam Judith A
Create a Home Valuation Report for This Property
The Home Valuation Report is an in-depth analysis detailing your home's value as well as a comparison with similar homes in the area
Home Values in the Area
Average Home Value in this Area
Purchase History
| Date | Buyer | Sale Price | Title Company |
|---|---|---|---|
| Howland Pleasant Gmf Llc | $1,200,000 | None Available | |
| Graves Mary | $165,000 | -- | |
| Howland St Rt | $45,000 | -- | |
| Citicorp Mtg Inc | $53,000 | -- | |
| Mcadam Judith A | $180,000 | -- |
Source: Public Records
Mortgage History
| Date | Status | Borrower | Loan Amount |
|---|---|---|---|
| Previous Owner | Mcadam Judith A | $412,000 | |
| Previous Owner | Mcadam Judith A | $360,000 |
Source: Public Records
Property History
| Date | Event | Price | List to Sale | Price per Sq Ft |
|---|---|---|---|---|
| 01/04/2025 01/04/25 | Off Market | $2,995 | -- | -- |
| 07/08/2024 07/08/24 | Price Changed | $2,995 | 0.0% | $3 / Sq Ft |
| 06/26/2024 06/26/24 | For Rent | $2,995 | -- | -- |
Tax History Compared to Growth
Tax History
| Year | Tax Paid | Tax Assessment Tax Assessment Total Assessment is a certain percentage of the fair market value that is determined by local assessors to be the total taxable value of land and additions on the property. | Land | Improvement |
|---|---|---|---|---|
| 2025 | $9,475 | $818,200 | $221,100 | $597,100 |
| 2024 | $9,220 | $845,900 | $196,700 | $649,200 |
| 2023 | $8,108 | $754,900 | $175,500 | $579,400 |
| 2022 | $7,702 | $707,900 | $164,000 | $543,900 |
| 2021 | $7,262 | $680,600 | $157,700 | $522,900 |
| 2020 | $6,053 | $573,200 | $152,200 | $421,000 |
| 2019 | $5,393 | $511,700 | $112,400 | $399,300 |
| 2018 | $5,105 | $487,100 | $112,400 | $374,700 |
| 2017 | $5,158 | $487,100 | $112,400 | $374,700 |
| 2016 | $3,993 | $363,000 | $112,400 | $250,600 |
| 2015 | $3,570 | $294,800 | $89,200 | $205,600 |
| 2014 | $3,312 | $263,300 | $89,200 | $174,100 |
Source: Public Records
Map
Nearby Homes
- 75 Ruthven St
- 9 Abbotsford St Unit 1
- 214 Humboldt Ave
- 4 Ruthven St
- 28 Wabon St
- 99 Harrishof St
- 164 Ruthven St Unit 1
- 151 Townsend St
- 78 Hutchings St Unit 1
- 4 Wyoming St Unit 2
- 7 Waumbeck St Unit 3
- 495 Warren St
- 90 Munroe St
- 41 W Walnut Park
- 476 Warren St
- 16 Mayfair St
- 5 Glenburne St
- 27 Dixwell St Unit 11
- 27 Dixwell St Unit 12
- 27 Dixwell St Unit 4
- 110 Howland St
- 110 Howland St Unit 1
- 110 Howland St Unit 4
- 110 Howland St Unit 3
- 110 Howland St Unit 2
- 112 Howland St
- 112 Howland St Unit 3
- 112 Howland St Unit 2
- 112 Howland St Unit 1
- 114 Howland St
- 106 Howland St
- 106 Howland St Unit 2
- 106 Howland St Unit 3
- 116 Howland St Unit 3
- 116 Howland St Unit 2
- 116 Howland St Unit 1
- 116 Howland St
- 111 Howland St
- 115 Howland St Unit 3
- 115 Howland St Unit 2