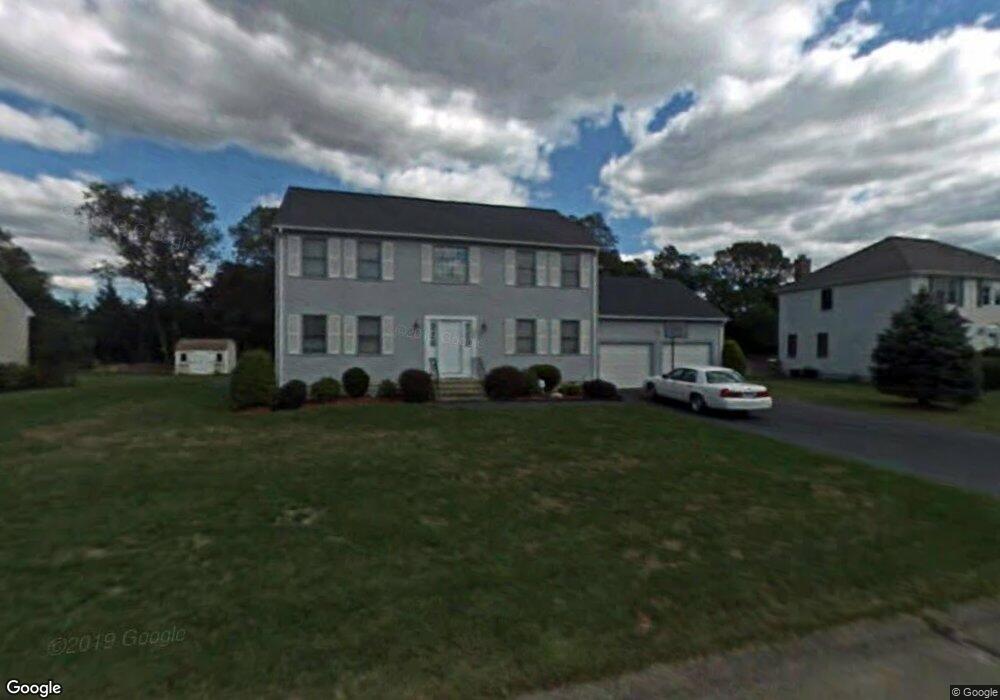
110 Jamie Ln Stoughton, MA 02072
Estimated Value: $800,000 - $820,000
4
Beds
3
Baths
2,267
Sq Ft
$357/Sq Ft
Est. Value
About This Home
This home is located at 110 Jamie Ln, Stoughton, MA 02072 and is currently estimated at $808,972, approximately $356 per square foot. 110 Jamie Ln is a home located in Norfolk County with nearby schools including Joseph H. Gibbons Elementary School, Dr. Robert G. O'Donnell Middle School, and Stoughton High School.
Ownership History
Date
Name
Owned For
Owner Type
Purchase Details
Closed on
Sep 28, 2007
Sold by
Melo Jose A and Melo Natalie
Bought by
Woodard Christine and Woodard Matthew P
Current Estimated Value
Home Financials for this Owner
Home Financials are based on the most recent Mortgage that was taken out on this home.
Original Mortgage
$392,000
Outstanding Balance
$250,333
Interest Rate
6.65%
Mortgage Type
Purchase Money Mortgage
Estimated Equity
$558,639
Purchase Details
Closed on
Jul 27, 1995
Sold by
Ruscito Tr Aldo
Bought by
Agm Construction Inc
Create a Home Valuation Report for This Property
The Home Valuation Report is an in-depth analysis detailing your home's value as well as a comparison with similar homes in the area
Home Values in the Area
Average Home Value in this Area
Purchase History
| Date | Buyer | Sale Price | Title Company |
|---|---|---|---|
| Woodard Christine | $490,000 | -- | |
| Woodard Christine | $490,000 | -- | |
| Agm Construction Inc | $70,000 | -- | |
| Agm Construction Inc | $70,000 | -- |
Source: Public Records
Mortgage History
| Date | Status | Borrower | Loan Amount |
|---|---|---|---|
| Open | Woodard Christine | $392,000 | |
| Closed | Agm Construction Inc | $392,000 |
Source: Public Records
Tax History Compared to Growth
Tax History
| Year | Tax Paid | Tax Assessment Tax Assessment Total Assessment is a certain percentage of the fair market value that is determined by local assessors to be the total taxable value of land and additions on the property. | Land | Improvement |
|---|---|---|---|---|
| 2025 | $8,815 | $712,000 | $222,200 | $489,800 |
| 2024 | $8,599 | $675,500 | $203,000 | $472,500 |
| 2023 | $8,481 | $625,900 | $185,500 | $440,400 |
| 2022 | $8,221 | $570,500 | $178,500 | $392,000 |
| 2021 | $7,964 | $527,400 | $157,500 | $369,900 |
| 2020 | $7,737 | $519,600 | $157,500 | $362,100 |
| 2019 | $7,520 | $490,200 | $157,500 | $332,700 |
| 2018 | $6,783 | $458,000 | $154,000 | $304,000 |
| 2017 | $6,535 | $451,000 | $152,200 | $298,800 |
| 2016 | $6,397 | $427,300 | $143,500 | $283,800 |
| 2015 | $6,332 | $418,500 | $134,700 | $283,800 |
| 2014 | $6,186 | $393,000 | $122,500 | $270,500 |
Source: Public Records
Map
Nearby Homes