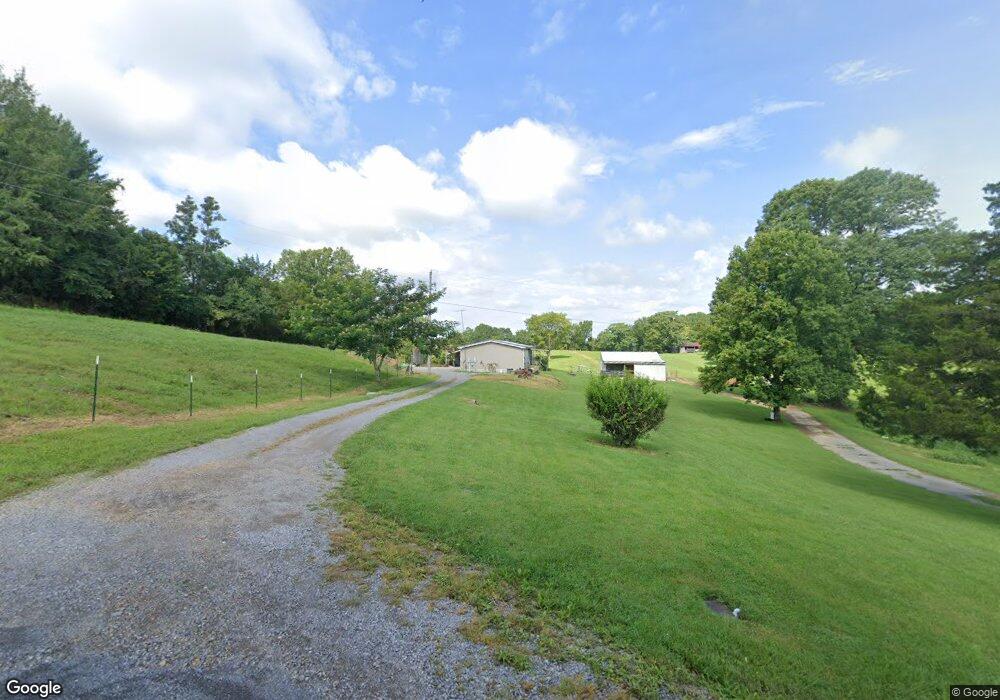
110 Lambert Ln Westmoreland, TN 37186
Estimated Value: $135,628 - $246,000
--
Bed
2
Baths
1,248
Sq Ft
$156/Sq Ft
Est. Value
About This Home
This home is located at 110 Lambert Ln, Westmoreland, TN 37186 and is currently estimated at $194,407, approximately $155 per square foot. 110 Lambert Ln is a home located in Macon County.
Ownership History
Date
Name
Owned For
Owner Type
Purchase Details
Closed on
Dec 1, 2023
Sold by
Ward Robert Lee
Bought by
Ward Chadwick Lane
Current Estimated Value
Home Financials for this Owner
Home Financials are based on the most recent Mortgage that was taken out on this home.
Original Mortgage
$175,000
Outstanding Balance
$172,167
Interest Rate
7.63%
Mortgage Type
Seller Take Back
Estimated Equity
$22,240
Purchase Details
Closed on
Mar 31, 2017
Sold by
Ward W L
Bought by
Ward W L L W and Ward E
Purchase Details
Closed on
Nov 28, 2016
Sold by
Dan Taylor
Bought by
Ward W
Home Financials for this Owner
Home Financials are based on the most recent Mortgage that was taken out on this home.
Original Mortgage
$52,000
Interest Rate
4.03%
Purchase Details
Closed on
Oct 27, 2016
Sold by
Dan
Bought by
Ward W L
Home Financials for this Owner
Home Financials are based on the most recent Mortgage that was taken out on this home.
Original Mortgage
$52,000
Interest Rate
4.03%
Purchase Details
Closed on
May 16, 2008
Sold by
Brenda Meador
Bought by
Dan Taylor
Create a Home Valuation Report for This Property
The Home Valuation Report is an in-depth analysis detailing your home's value as well as a comparison with similar homes in the area
Home Values in the Area
Average Home Value in this Area
Purchase History
| Date | Buyer | Sale Price | Title Company |
|---|---|---|---|
| Ward Chadwick Lane | -- | Benchmark Title | |
| Ward W L L W | -- | -- | |
| Ward W | -- | -- | |
| Ward W L | $64,500 | -- | |
| Dan Taylor | $39,731 | -- |
Source: Public Records
Mortgage History
| Date | Status | Borrower | Loan Amount |
|---|---|---|---|
| Open | Ward Chadwick Lane | $175,000 | |
| Previous Owner | Dan Taylor | $52,000 | |
| Previous Owner | Dan Taylor | -- |
Source: Public Records
Tax History Compared to Growth
Tax History
| Year | Tax Paid | Tax Assessment Tax Assessment Total Assessment is a certain percentage of the fair market value that is determined by local assessors to be the total taxable value of land and additions on the property. | Land | Improvement |
|---|---|---|---|---|
| 2024 | $714 | $51,075 | $15,550 | $35,525 |
| 2023 | $714 | $50,525 | $0 | $0 |
| 2022 | $699 | $29,125 | $11,675 | $17,450 |
| 2021 | $699 | $29,125 | $11,675 | $17,450 |
| 2020 | $699 | $29,125 | $11,675 | $17,450 |
| 2019 | $699 | $29,125 | $11,675 | $17,450 |
| 2018 | $645 | $29,125 | $11,675 | $17,450 |
| 2017 | $584 | $23,175 | $5,575 | $17,600 |
| 2016 | $550 | $22,900 | $5,575 | $17,325 |
| 2015 | $550 | $22,900 | $5,575 | $17,325 |
| 2014 | $550 | $22,915 | $0 | $0 |
Source: Public Records
Map
Nearby Homes
- 670 Howell Rd
- 11076 Highway 52 W
- 295 Akins Heights Ln
- 234 Haven Way
- 10029 Old Highway 52
- 6221 Austin Peay Hwy
- 458 Robins Trail
- 393 Leaths Branch Rd
- 401 Robins Trail
- 401 Robin's Trail
- 219 Wagoners Way
- 4169 Bledsoe St
- 1112 New Highway 52 E
- 1131 New Hwy 52
- 1123 New Hwy 52
- 397 Lauren Ln
- 5270 New Highway 31e
- 177 Lauren Ln
- 2131 Lambert Dr
- 8943 Phillips Hollow Rd
- 61 Lambert Ln
- 11665 Highway 52 W
- 11630 Highway 52 W
- 11560 Highway 52 W
- 405 Howell Rd
- 11849 Highway 52 W
- 10803 Old Highway 52
- 10861 Old Highway 52
- 10834 Old Highway 52
- 345 Howell Rd
- 10915 Old Highway 52
- 11850 Highway 52 W
- 10939 Old Highway 52
- 10870 Old Highway 52
- 10720 Old Highway 52
- 10720 Old Highway 52
- 10904 Old Highway 52
- 10965 Old Highway 52
- 10816 Old Highway 52
- 10987 Old Highway 52