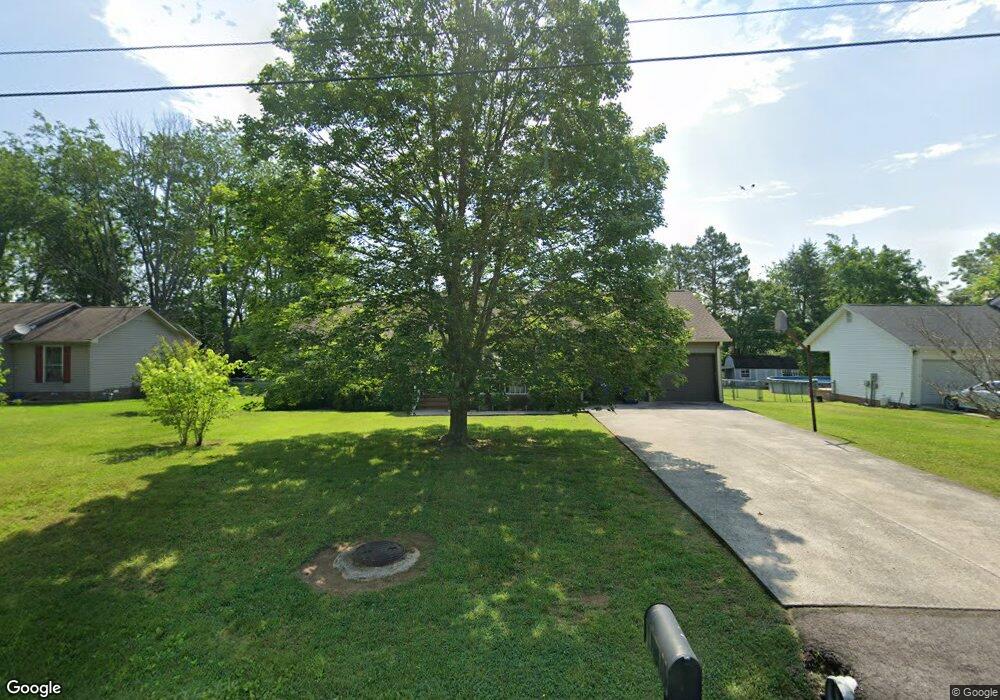
110 Lantern Ln Shelbyville, TN 37160
Estimated Value: $256,513 - $316,000
--
Bed
2
Baths
1,584
Sq Ft
$187/Sq Ft
Est. Value
About This Home
This home is located at 110 Lantern Ln, Shelbyville, TN 37160 and is currently estimated at $296,878, approximately $187 per square foot. 110 Lantern Ln is a home located in Bedford County with nearby schools including South Side Elementary School, Harris Middle School, and Christian Chapel Academy.
Ownership History
Date
Name
Owned For
Owner Type
Purchase Details
Closed on
Jul 2, 1999
Sold by
Payne Sherry N
Bought by
Fletcher Cathy S
Current Estimated Value
Home Financials for this Owner
Home Financials are based on the most recent Mortgage that was taken out on this home.
Original Mortgage
$70,000
Outstanding Balance
$19,040
Interest Rate
7.43%
Estimated Equity
$277,838
Purchase Details
Closed on
Jun 26, 1995
Bought by
Payne Sherry N
Purchase Details
Closed on
Jun 19, 1992
Bought by
Payne John Thomas
Purchase Details
Closed on
Jan 15, 1992
Bought by
Mary Raulerson W and Mary Alice
Purchase Details
Closed on
May 5, 1990
Bought by
Kelton Const Inc
Purchase Details
Closed on
Jan 11, 1989
Bought by
Flippo Belton
Create a Home Valuation Report for This Property
The Home Valuation Report is an in-depth analysis detailing your home's value as well as a comparison with similar homes in the area
Home Values in the Area
Average Home Value in this Area
Purchase History
| Date | Buyer | Sale Price | Title Company |
|---|---|---|---|
| Fletcher Cathy S | $90,000 | -- | |
| Payne Sherry N | -- | -- | |
| Payne John Thomas | $73,500 | -- | |
| Mary Raulerson W | $65,000 | -- | |
| Kelton Const Inc | $8,000 | -- | |
| Flippo Belton | -- | -- |
Source: Public Records
Mortgage History
| Date | Status | Borrower | Loan Amount |
|---|---|---|---|
| Open | Flippo Belton | $70,000 |
Source: Public Records
Tax History Compared to Growth
Tax History
| Year | Tax Paid | Tax Assessment Tax Assessment Total Assessment is a certain percentage of the fair market value that is determined by local assessors to be the total taxable value of land and additions on the property. | Land | Improvement |
|---|---|---|---|---|
| 2025 | -- | $41,550 | $0 | $0 |
| 2024 | -- | $41,550 | $7,250 | $34,300 |
| 2023 | $1,581 | $41,550 | $7,250 | $34,300 |
| 2022 | $1,627 | $41,550 | $7,250 | $34,300 |
| 2021 | $1,478 | $41,550 | $7,250 | $34,300 |
| 2020 | $1,289 | $41,550 | $7,250 | $34,300 |
| 2019 | $1,289 | $29,100 | $5,500 | $23,600 |
| 2018 | $1,260 | $29,100 | $5,500 | $23,600 |
| 2017 | $1,260 | $29,100 | $5,500 | $23,600 |
| 2016 | $1,248 | $29,100 | $5,500 | $23,600 |
| 2015 | $1,248 | $29,100 | $5,500 | $23,600 |
| 2014 | $1,053 | $26,854 | $0 | $0 |
Source: Public Records
Map
Nearby Homes