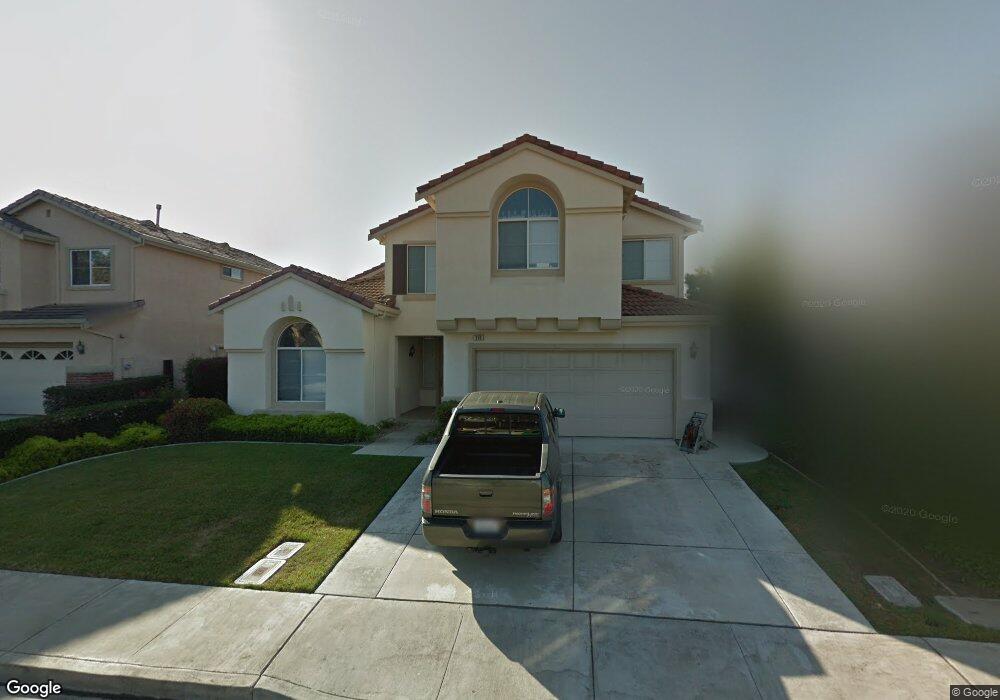
110 Marjoram Loop Union City, CA 94587
Downtown Union City NeighborhoodEstimated Value: $1,531,394 - $1,664,000
5
Beds
3
Baths
2,300
Sq Ft
$694/Sq Ft
Est. Value
About This Home
This home is located at 110 Marjoram Loop, Union City, CA 94587 and is currently estimated at $1,595,849, approximately $693 per square foot. 110 Marjoram Loop is a home located in Alameda County with nearby schools including Guy Jr. Emanuele Elementary School, Cesar Chavez Middle School, and James Logan High School.
Ownership History
Date
Name
Owned For
Owner Type
Purchase Details
Closed on
Jan 25, 1999
Sold by
Scs Development Co
Bought by
Su Jinntung and Su Teddy J
Current Estimated Value
Home Financials for this Owner
Home Financials are based on the most recent Mortgage that was taken out on this home.
Original Mortgage
$307,100
Outstanding Balance
$72,439
Interest Rate
6.7%
Estimated Equity
$1,523,410
Create a Home Valuation Report for This Property
The Home Valuation Report is an in-depth analysis detailing your home's value as well as a comparison with similar homes in the area
Home Values in the Area
Average Home Value in this Area
Purchase History
| Date | Buyer | Sale Price | Title Company |
|---|---|---|---|
| Su Jinntung | $384,000 | First American Title Guarant |
Source: Public Records
Mortgage History
| Date | Status | Borrower | Loan Amount |
|---|---|---|---|
| Open | Su Jinntung | $307,100 |
Source: Public Records
Tax History Compared to Growth
Tax History
| Year | Tax Paid | Tax Assessment Tax Assessment Total Assessment is a certain percentage of the fair market value that is determined by local assessors to be the total taxable value of land and additions on the property. | Land | Improvement |
|---|---|---|---|---|
| 2025 | $9,442 | $601,651 | $180,589 | $421,062 |
| 2024 | $9,442 | $589,857 | $177,049 | $412,808 |
| 2023 | $9,139 | $578,293 | $173,578 | $404,715 |
| 2022 | $8,975 | $566,956 | $170,175 | $396,781 |
| 2021 | $8,777 | $555,841 | $166,839 | $389,002 |
| 2020 | $8,609 | $550,141 | $165,128 | $385,013 |
| 2019 | $8,675 | $539,357 | $161,891 | $377,466 |
| 2018 | $8,476 | $528,783 | $158,717 | $370,066 |
| 2017 | $8,277 | $518,417 | $155,606 | $362,811 |
| 2016 | $7,985 | $508,253 | $152,555 | $355,698 |
| 2015 | $7,833 | $500,620 | $150,264 | $350,356 |
| 2014 | $7,549 | $490,814 | $147,321 | $343,493 |
Source: Public Records
Map
Nearby Homes
- 126 Bellflower Ln
- 34237 Torrey Pine Ln
- 1020 Carnelian Terrace
- 35005 11th St
- 365 Monaco Ave
- 33718 3rd St
- 213 Ladera Plaza Unit 13
- 208 Appian Way
- 33852 11th St
- 352 Monte Carlo Ave
- 33848 10th St
- 33840 10th St
- 217 Appian Way
- 33853 10th St
- 33603 3rd St
- 902 G St
- 33548 4th St
- 35180 Mount Whitney Terrace
- 33846 14th St
- 35560 Monterra Terrace Unit 301
- 112 Marjoram Loop
- 108 Marjoram Loop
- 103 Valley Oaks Loop
- 105 Valley Oaks Loop
- 114 Marjoram Loop
- 101 Valley Oaks Loop
- 34336 Marjoram Loop
- 34345 Marjoram Loop
- 107 Valley Oaks Loop
- 34337 Myrtle Ln
- 34341 Marjoram Loop
- 34415 Valley Oaks Loop
- 34332 Marjoram Loop
- 34333 Myrtle Ln
- 34337 Marjoram Loop
- 121 Blue Spruce Ln
- 102 Valley Oaks Loop
- 34328 Marjoram Loop
- 34417 Valley Oaks Loop
- 104 Valley Oaks Loop