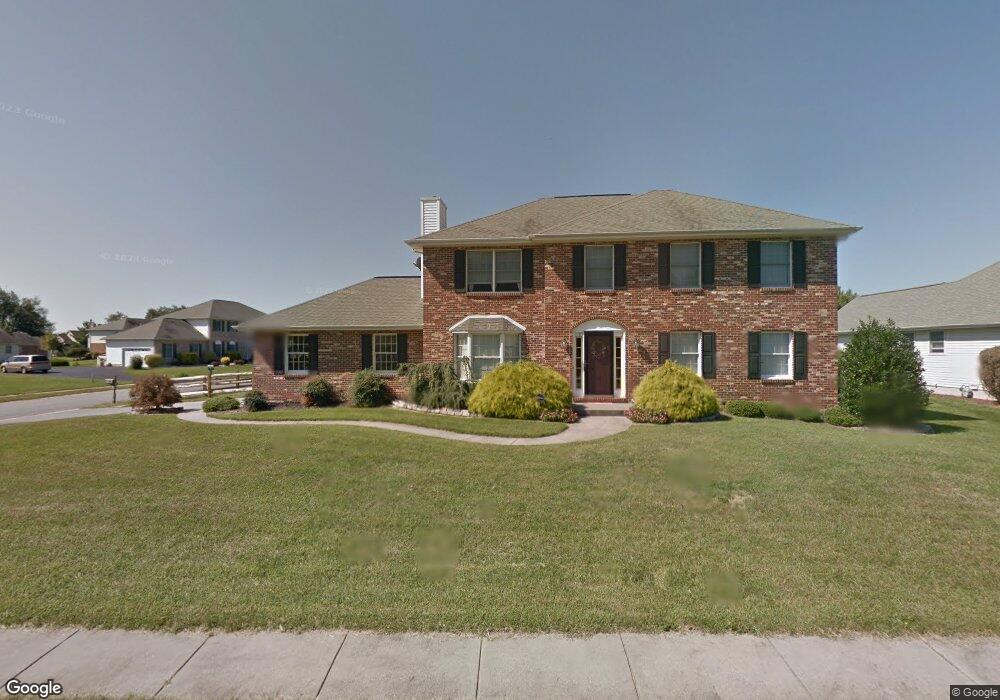
110 Megan Dr Bear, DE 19701
Kirkwood NeighborhoodEstimated Value: $532,000 - $588,000
4
Beds
3
Baths
2,369
Sq Ft
$235/Sq Ft
Est. Value
About This Home
This home is located at 110 Megan Dr, Bear, DE 19701 and is currently estimated at $555,610, approximately $234 per square foot. 110 Megan Dr is a home located in New Castle County with nearby schools including Alfred G. Waters Middle School, Appoquinimink High School, and Glasgow Christian Academy.
Ownership History
Date
Name
Owned For
Owner Type
Purchase Details
Closed on
Jul 19, 2024
Sold by
Marston Sarah and Marston Patrick
Bought by
Marston Patrick
Current Estimated Value
Purchase Details
Closed on
May 1, 2020
Sold by
Clark George A
Bought by
Marston Patrick and Marston Sarah
Home Financials for this Owner
Home Financials are based on the most recent Mortgage that was taken out on this home.
Original Mortgage
$368,207
Interest Rate
4.25%
Mortgage Type
FHA
Purchase Details
Closed on
May 24, 2000
Bought by
Clark George A
Create a Home Valuation Report for This Property
The Home Valuation Report is an in-depth analysis detailing your home's value as well as a comparison with similar homes in the area
Home Values in the Area
Average Home Value in this Area
Purchase History
| Date | Buyer | Sale Price | Title Company |
|---|---|---|---|
| Marston Patrick | $375,000 | None Listed On Document | |
| Marston Patrick | $375,000 | None Available | |
| Clark George A | -- | -- |
Source: Public Records
Mortgage History
| Date | Status | Borrower | Loan Amount |
|---|---|---|---|
| Previous Owner | Marston Patrick | $368,207 |
Source: Public Records
Tax History
| Year | Tax Paid | Tax Assessment Tax Assessment Total Assessment is a certain percentage of the fair market value that is determined by local assessors to be the total taxable value of land and additions on the property. | Land | Improvement |
|---|---|---|---|---|
| 2024 | $3,765 | $87,000 | $12,500 | $74,500 |
| 2023 | $3,229 | $87,000 | $12,500 | $74,500 |
| 2022 | $3,238 | $87,000 | $12,500 | $74,500 |
| 2021 | $3,198 | $87,000 | $12,500 | $74,500 |
| 2020 | $3,163 | $87,000 | $12,500 | $74,500 |
| 2019 | $3,323 | $87,000 | $12,500 | $74,500 |
| 2018 | $299 | $87,000 | $12,500 | $74,500 |
| 2017 | $2,440 | $85,500 | $12,500 | $73,000 |
| 2016 | $2,440 | $85,500 | $12,500 | $73,000 |
| 2015 | $2,375 | $85,500 | $12,500 | $73,000 |
| 2014 | $2,382 | $85,500 | $12,500 | $73,000 |
Source: Public Records
Map
Nearby Homes
- 48 Marble House Dr
- 15 Eaton Place
- 557 Mansion House Rd
- 2 Pegasus Place
- 52 Eaton Place
- 5 Worthy Down Ave
- 152 W Savannah Dr
- 7 Keeneland Ct
- 25 Shawn Ln
- 4 Riva Ridge Ln
- 1 Bohemia Rd
- 2664 Glasgow Ave
- 204 Springwood Dr
- 222 Springwood Dr
- 18 Devalinder Dr
- 1 Jasmine Dr
- 121 Devalinder Dr
- 103 Sarah Cir
- 45 Longleaf Ln
- 61 Rose Hill Dr
Your Personal Tour Guide
Ask me questions while you tour the home.