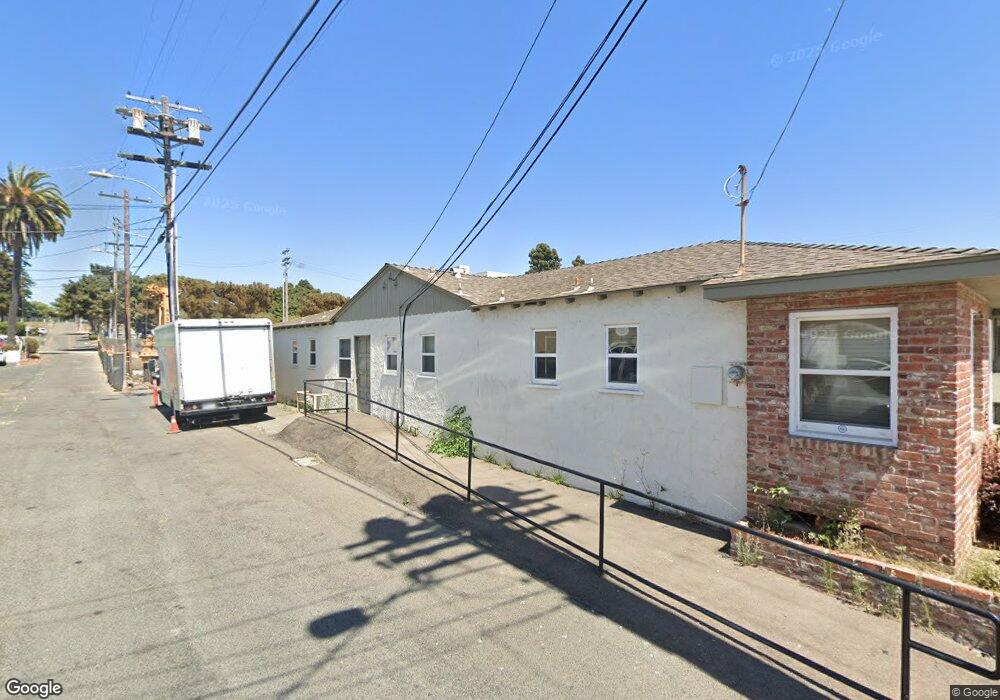
110 N Ditmar St Oceanside, CA 92054
Downtown Oceanside NeighborhoodEstimated Value: $1,218,746
--
Bed
--
Bath
1,584
Sq Ft
$769/Sq Ft
Est. Value
About This Home
This home is located at 110 N Ditmar St, Oceanside, CA 92054 and is currently estimated at $1,218,746, approximately $769 per square foot. 110 N Ditmar St is a home located in San Diego County with nearby schools including South Oceanside Elementary School, Lincoln Middle School, and Oceanside High School.
Ownership History
Date
Name
Owned For
Owner Type
Purchase Details
Closed on
Jan 18, 2022
Sold by
Huckabay Evan M
Bought by
Evan Huckabay Living Trust
Current Estimated Value
Purchase Details
Closed on
Oct 31, 2017
Sold by
Hatter Larry W and Hatter Cathleen E
Bought by
Huckabay Evan M
Home Financials for this Owner
Home Financials are based on the most recent Mortgage that was taken out on this home.
Original Mortgage
$556,000
Interest Rate
3.85%
Mortgage Type
Seller Take Back
Create a Home Valuation Report for This Property
The Home Valuation Report is an in-depth analysis detailing your home's value as well as a comparison with similar homes in the area
Home Values in the Area
Average Home Value in this Area
Purchase History
| Date | Buyer | Sale Price | Title Company |
|---|---|---|---|
| Evan Huckabay Living Trust | -- | None Listed On Document | |
| Huckabay Evan M | $695,000 | Corinthian Title Company |
Source: Public Records
Mortgage History
| Date | Status | Borrower | Loan Amount |
|---|---|---|---|
| Previous Owner | Huckabay Evan M | $556,000 |
Source: Public Records
Tax History Compared to Growth
Tax History
| Year | Tax Paid | Tax Assessment Tax Assessment Total Assessment is a certain percentage of the fair market value that is determined by local assessors to be the total taxable value of land and additions on the property. | Land | Improvement |
|---|---|---|---|---|
| 2025 | $8,736 | $790,788 | $398,238 | $392,550 |
| 2024 | $8,736 | $775,283 | $390,430 | $384,853 |
| 2023 | $9,099 | $760,082 | $382,775 | $377,307 |
| 2022 | $8,972 | $745,179 | $375,270 | $369,909 |
| 2021 | $9,005 | $730,568 | $367,912 | $362,656 |
| 2020 | $8,746 | $723,078 | $364,140 | $358,938 |
| 2019 | $8,511 | $708,900 | $357,000 | $351,900 |
| 2018 | $7,797 | $695,000 | $350,000 | $345,000 |
| 2017 | $1,020 | $85,751 | $37,799 | $47,952 |
| 2016 | $988 | $84,070 | $37,058 | $47,012 |
| 2015 | $961 | $82,808 | $36,502 | $46,306 |
| 2014 | $927 | $81,186 | $35,787 | $45,399 |
Source: Public Records
Map
Nearby Homes
- 110 S Freeman St
- 109 S Horne St
- 301 Mission Ave Unit 509
- 401 N Coast Hwy Unit 314
- 301 S Horne St
- 580 Sportfisher Dr Unit C
- 324 S Nevada St
- 321 S Freeman St
- 355 N Cleveland St Unit 206
- 355 N Cleveland St Unit 101
- 513 N Freeman St Unit C
- 509 N Horne St
- 508 N Tremont St Unit A
- 421 N Weitzel St
- 150 S Myers St Unit 1
- 410 S Freeman St Unit 10
- 1223 Division St
- 610 N Tremont St
- 208 S Pacific St
- 701 N Nevada St
- 712 Seagaze Dr
- 709 Mission Ave
- 709 709 Mission Ave
- 701 Mission Ave
- 713 Mission Ave
- 713 Mission Ave Unit D
- 716 Seagaze Dr
- 615 Mission Ave
- 711 Mission Ave Unit B
- 711 Mission Ave
- 607 Mission Ave
- 0 S Nevada St Unit 100069441
- 0 S Nevada St Unit 6 110021696
- 0 S Nevada St Unit 21-788482
- 605 Mission Ave
- 605.5 AND 605 5 and 607 Mission
- 605 605 Mission
- 605.5 and 607 Mission
- 607 607 Mission Ave
- 801 Mission Ave