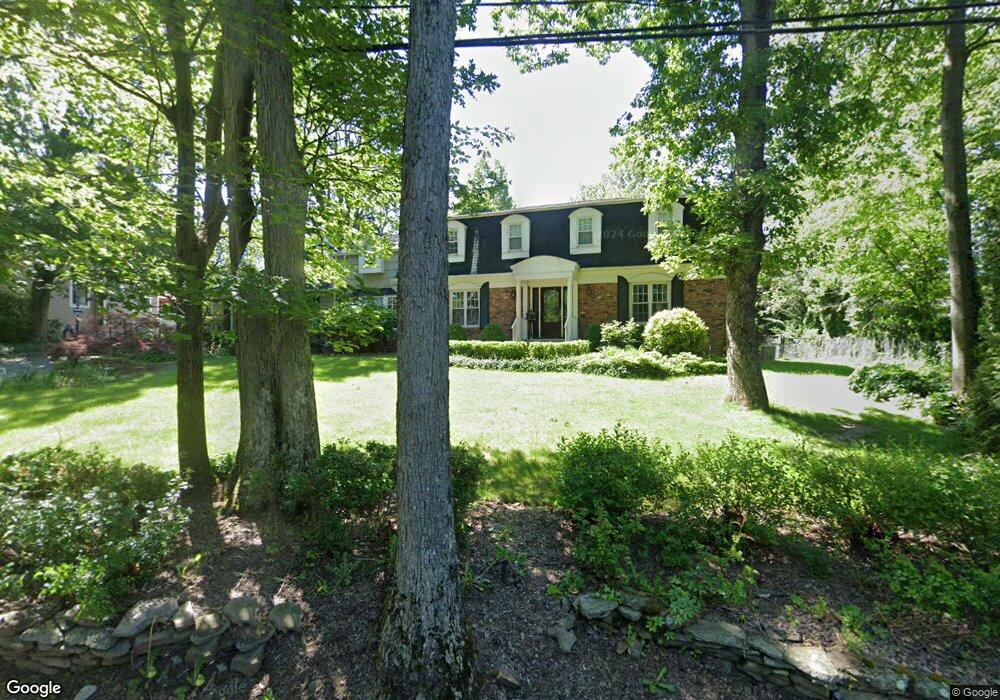
110 Oakwood Dr New Providence, NJ 07974
Estimated Value: $1,424,806 - $1,852,000
--
Bed
--
Bath
3,685
Sq Ft
$431/Sq Ft
Est. Value
About This Home
This home is located at 110 Oakwood Dr, New Providence, NJ 07974 and is currently estimated at $1,586,452, approximately $430 per square foot. 110 Oakwood Dr is a home located in Union County with nearby schools including New Providence High School, The Academy of Our Lady of Peace, and Oak Knoll School of the Holy Child.
Ownership History
Date
Name
Owned For
Owner Type
Purchase Details
Closed on
May 23, 2016
Sold by
James Covello
Bought by
Opperthauser Daniel and Opperthauser Marianne
Current Estimated Value
Home Financials for this Owner
Home Financials are based on the most recent Mortgage that was taken out on this home.
Original Mortgage
$625,000
Outstanding Balance
$496,243
Interest Rate
3.58%
Estimated Equity
$1,090,209
Purchase Details
Closed on
Jun 29, 1998
Sold by
Vladimer Seymour L and Vladimer Violet P
Bought by
Saleh Javed B and Aziz Rubina
Home Financials for this Owner
Home Financials are based on the most recent Mortgage that was taken out on this home.
Original Mortgage
$484,000
Interest Rate
7.04%
Create a Home Valuation Report for This Property
The Home Valuation Report is an in-depth analysis detailing your home's value as well as a comparison with similar homes in the area
Home Values in the Area
Average Home Value in this Area
Purchase History
| Date | Buyer | Sale Price | Title Company |
|---|---|---|---|
| Opperthauser Daniel | -- | -- | |
| Saleh Javed B | $605,000 | -- |
Source: Public Records
Mortgage History
| Date | Status | Borrower | Loan Amount |
|---|---|---|---|
| Open | Opperthauser Daniel | $625,000 | |
| Closed | Opperthauser Daniel | -- | |
| Previous Owner | Saleh Javed B | $484,000 |
Source: Public Records
Tax History Compared to Growth
Tax History
| Year | Tax Paid | Tax Assessment Tax Assessment Total Assessment is a certain percentage of the fair market value that is determined by local assessors to be the total taxable value of land and additions on the property. | Land | Improvement |
|---|---|---|---|---|
| 2025 | $28,050 | $543,400 | $210,900 | $332,500 |
| 2024 | $27,208 | $543,400 | $210,900 | $332,500 |
| 2023 | $27,208 | $543,400 | $210,900 | $332,500 |
| 2022 | $26,833 | $543,400 | $210,900 | $332,500 |
| 2021 | $26,637 | $543,400 | $210,900 | $332,500 |
| 2020 | $26,627 | $543,400 | $210,900 | $332,500 |
| 2019 | $26,464 | $543,400 | $210,900 | $332,500 |
| 2018 | $26,328 | $543,400 | $210,900 | $332,500 |
| 2017 | $25,898 | $543,400 | $210,900 | $332,500 |
| 2016 | $25,534 | $543,400 | $210,900 | $332,500 |
| 2015 | $29,815 | $643,400 | $210,900 | $432,500 |
| 2014 | $29,365 | $643,400 | $210,900 | $432,500 |
Source: Public Records
Map
Nearby Homes
- 52 Greenwood Rd
- 340 Livingston Ave
- 183 Countryside Dr
- 140 Countryside Dr
- 45 the Fellsway
- 282 South St
- 34 Grant Ave
- 16 Riverbend Ct
- 32 Marion Ave
- 106 Stoneridge Rd
- 20 High St
- 54 Badgley Dr
- 6 Joanna Way
- 72 Central Ave
- 1200 Springfield Ave Unit 1B
- 14 Holmes Oval
- 16 Terrace Rd
- 34 Sweetbriar Rd
- 36 Terrace Rd
- 32 Charnwood Rd