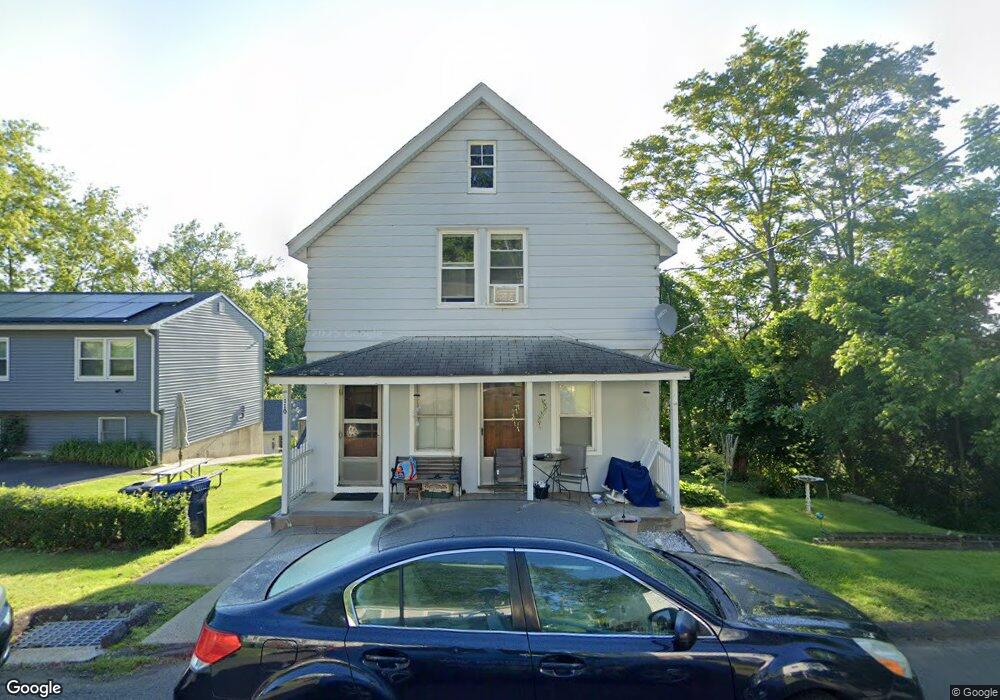
110 Orford St West Haven, CT 06516
Allingtown NeighborhoodEstimated Value: $346,112 - $415,000
3
Beds
2
Baths
1,572
Sq Ft
$243/Sq Ft
Est. Value
About This Home
This home is located at 110 Orford St, West Haven, CT 06516 and is currently estimated at $382,028, approximately $243 per square foot. 110 Orford St is a home located in New Haven County with nearby schools including Carrigan 5/6 Intermediate School, Harry M. Bailey Middle School, and West Haven High School.
Ownership History
Date
Name
Owned For
Owner Type
Purchase Details
Closed on
Mar 31, 2025
Sold by
Sandella Gary
Bought by
Gary M Sandella Lt and Sandella
Current Estimated Value
Purchase Details
Closed on
Sep 8, 1989
Sold by
Farina Raymond
Bought by
Sandella Nicholas
Home Financials for this Owner
Home Financials are based on the most recent Mortgage that was taken out on this home.
Original Mortgage
$112,000
Interest Rate
9.71%
Mortgage Type
Purchase Money Mortgage
Create a Home Valuation Report for This Property
The Home Valuation Report is an in-depth analysis detailing your home's value as well as a comparison with similar homes in the area
Home Values in the Area
Average Home Value in this Area
Purchase History
| Date | Buyer | Sale Price | Title Company |
|---|---|---|---|
| Gary M Sandella Lt | -- | None Available | |
| Gary M Sandella Lt | -- | None Available | |
| Sandella Nicholas | $140,000 | -- |
Source: Public Records
Mortgage History
| Date | Status | Borrower | Loan Amount |
|---|---|---|---|
| Previous Owner | Sandella Nicholas | $113,000 | |
| Previous Owner | Sandella Nicholas | $110,000 | |
| Previous Owner | Sandella Nicholas | $112,000 |
Source: Public Records
Tax History Compared to Growth
Tax History
| Year | Tax Paid | Tax Assessment Tax Assessment Total Assessment is a certain percentage of the fair market value that is determined by local assessors to be the total taxable value of land and additions on the property. | Land | Improvement |
|---|---|---|---|---|
| 2025 | $6,392 | $187,950 | $63,140 | $124,810 |
| 2024 | $5,437 | $113,540 | $43,750 | $69,790 |
| 2023 | $5,271 | $113,540 | $43,750 | $69,790 |
| 2022 | $5,179 | $113,540 | $43,750 | $69,790 |
| 2021 | $5,180 | $113,540 | $43,750 | $69,790 |
| 2020 | $4,910 | $95,340 | $35,420 | $59,920 |
| 2019 | $4,834 | $95,340 | $35,420 | $59,920 |
| 2018 | $4,702 | $95,340 | $35,420 | $59,920 |
| 2017 | $4,555 | $95,340 | $35,420 | $59,920 |
| 2016 | $4,417 | $95,340 | $35,420 | $59,920 |
| 2015 | $4,392 | $107,940 | $38,290 | $69,650 |
| 2014 | $4,305 | $107,940 | $38,290 | $69,650 |
Source: Public Records
Map
Nearby Homes
- 107 Tuthill St
- 39 Medford St
- 62 Tuthill St
- 194 Homeside Ave
- 57 Dalton St
- 89 Coleman St Unit 213
- 265 Tuthill St
- 63 Glade St Unit C1
- 182 Meloy Rd
- 227 W Spring St
- 81 Homeside Ave
- 35 Terrace Ave
- 387 W Spring St
- 12 Linda St
- 78 Nonquit St
- 161 W Spring St Unit B2
- 161 W Spring St Unit C1
- 67 Putney Dr
- 84 Eileen Rd
- 104 Terrace Ave