
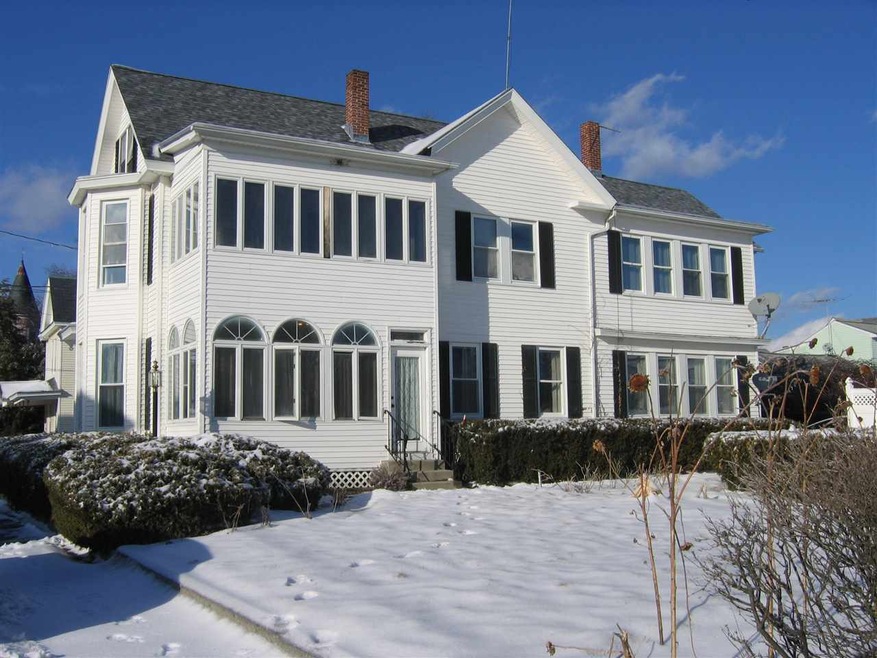
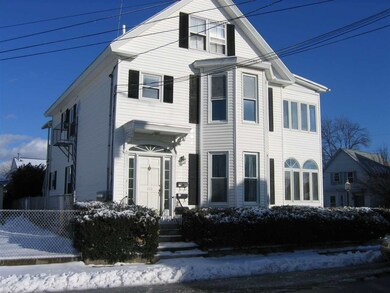
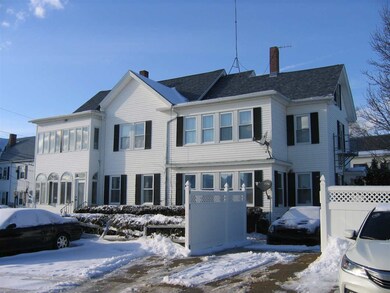
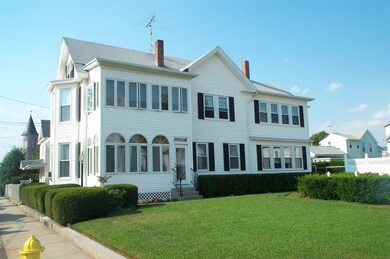

110 Palm St Nashua, NH 03060
South End Nashua Neighborhood
5
Beds
3
Baths
2,698
Sq Ft
7,841
Sq Ft Lot
About This Home
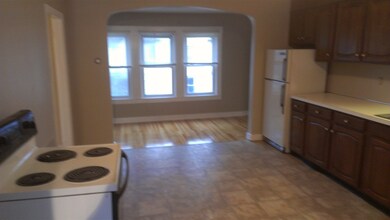
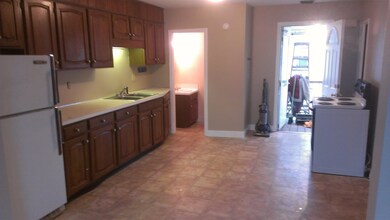
As of April 2020This is the one you've been waiting for !! Excellent Nashua 3 family for owner occupied or investor. One 2 BR unit and two 1 BR units. Finished attic rooms could be added for more space for unit #2. Vinyl siding, new roof, separate utilities and gas heat. Corner lot, large lot and lots of parking.
Last Agent to Sell the Property
RE/MAX Innovative Properties License #000422 Listed on: 02/14/2018
Property Details
Home Type
- Multi-Family
Est. Annual Taxes
- $5,328
Year Built
- Built in 1895
Lot Details
- 7,841 Sq Ft Lot
- Corner Lot
- Level Lot
Parking
- Paved Parking
Home Design
- Stone Foundation
- Wood Frame Construction
- Architectural Shingle Roof
- Vinyl Siding
Interior Spaces
- 3 Full Bathrooms
- 2.5-Story Property
- Unfinished Basement
- Interior Basement Entry
Schools
- Fairgrounds Elementary School
- Elm Street Middle School
- Nashua High School South
Utilities
- Hot Water Heating System
- Heating System Uses Natural Gas
- 100 Amp Service
- Natural Gas Water Heater
Listing and Financial Details
- Tax Lot 00039
Community Details
Overview
- 3 Units
Building Details
- 3 Separate Gas Meters
- Operating Expense $2,800
- Gross Income $40,800
Ownership History
Date
Name
Owned For
Owner Type
Purchase Details
Listed on
Mar 14, 2020
Closed on
Apr 29, 2020
Sold by
Smola Jeremy P and Smola Christine Tran
Bought by
Marrocco Mark and Marrocco Keila
Seller's Agent
Tim Joyce
Keller Williams Gateway Realty
Buyer's Agent
Claudia Dodds
RE/MAX Innovative Properties
List Price
$425,000,000
Sold Price
$420,000
Premium/Discount to List
-$424,580,000
-99.9%
Current Estimated Value
Home Financials for this Owner
Home Financials are based on the most recent Mortgage that was taken out on this home.
Estimated Appreciation
$254,993
Avg. Annual Appreciation
9.46%
Original Mortgage
$315,000
Outstanding Balance
$283,610
Interest Rate
3.6%
Mortgage Type
Purchase Money Mortgage
Estimated Equity
$391,383
Purchase Details
Listed on
Feb 14, 2018
Closed on
Mar 30, 2018
Sold by
Clark Ft
Bought by
Tran Chrsitine and Smola Jeremy P
Seller's Agent
Gary Rocca
RE/MAX Innovative Properties
Buyer's Agent
Tim Joyce
Keller Williams Gateway Realty
List Price
$349,900
Sold Price
$340,000
Premium/Discount to List
-$9,900
-2.83%
Home Financials for this Owner
Home Financials are based on the most recent Mortgage that was taken out on this home.
Avg. Annual Appreciation
10.64%
Original Mortgage
$255,000
Interest Rate
4.38%
Mortgage Type
Purchase Money Mortgage
Purchase Details
Closed on
Aug 25, 2003
Sold by
Vaillancourt Maurice A and Vaillancourt Lucienne G
Bought by
Clark Craig W and Clark Patricia H
Home Financials for this Owner
Home Financials are based on the most recent Mortgage that was taken out on this home.
Original Mortgage
$280,000
Interest Rate
5.52%
Similar Home in Nashua, NH
Create a Home Valuation Report for This Property
The Home Valuation Report is an in-depth analysis detailing your home's value as well as a comparison with similar homes in the area
Home Values in the Area
Average Home Value in this Area
Purchase History
| Date | Type | Sale Price | Title Company |
|---|---|---|---|
| Warranty Deed | $420,000 | None Available | |
| Warranty Deed | $340,000 | -- | |
| Warranty Deed | $350,000 | -- |
Source: Public Records
Mortgage History
| Date | Status | Loan Amount | Loan Type |
|---|---|---|---|
| Open | $315,000 | Purchase Money Mortgage | |
| Previous Owner | $255,000 | Purchase Money Mortgage | |
| Previous Owner | $280,000 | No Value Available |
Source: Public Records
Property History
| Date | Event | Price | Change | Sq Ft Price |
|---|---|---|---|---|
| 04/30/2020 04/30/20 | Sold | $420,000 | -99.9% | $156 / Sq Ft |
| 03/18/2020 03/18/20 | Pending | -- | -- | -- |
| 03/14/2020 03/14/20 | For Sale | $425,000,000 | +124900.0% | $157,524 / Sq Ft |
| 03/30/2018 03/30/18 | Sold | $340,000 | -2.8% | $126 / Sq Ft |
| 02/22/2018 02/22/18 | Pending | -- | -- | -- |
| 02/14/2018 02/14/18 | For Sale | $349,900 | -- | $130 / Sq Ft |
Source: PrimeMLS
Tax History Compared to Growth
Tax History
| Year | Tax Paid | Tax Assessment Tax Assessment Total Assessment is a certain percentage of the fair market value that is determined by local assessors to be the total taxable value of land and additions on the property. | Land | Improvement |
|---|---|---|---|---|
| 2023 | $8,614 | $472,500 | $111,700 | $360,800 |
| 2022 | $8,538 | $472,500 | $111,700 | $360,800 |
| 2021 | $7,073 | $304,600 | $74,400 | $230,200 |
| 2020 | $3,741 | $303,800 | $74,400 | $229,400 |
| 2019 | $3,689 | $303,800 | $74,400 | $229,400 |
| 2018 | $6,444 | $303,800 | $74,400 | $229,400 |
| 2017 | $3,538 | $206,600 | $71,000 | $135,600 |
| 2016 | $5,179 | $206,600 | $71,000 | $135,600 |
| 2015 | $5,068 | $206,600 | $71,000 | $135,600 |
| 2014 | $4,969 | $206,600 | $71,000 | $135,600 |
Source: Public Records
Agents Affiliated with this Home
-
Seller's Agent in 2020
Tim Joyce
Keller Williams Gateway Realty
(603) 765-3761
4 in this area
41 Total Sales
-
Buyer's Agent in 2020
Claudia Dodds
RE/MAX
(603) 425-4532
54 Total Sales
-
Seller's Agent in 2018
Gary Rocca
RE/MAX
(603) 589-8800
4 in this area
22 Total Sales
Map
Source: PrimeMLS
MLS Number: 4676760
APN: NASH-000096-000000-000039
Disclaimer: Certain information contained herein is derived from information provided by parties other than Homes.com. All information provided is deemed reliable, but is not guaranteed to be accurate and should be independently verified.
![]() Copyright 2025 PrimeMLS, Inc. All rights reserved. This information is deemed reliable, but not guaranteed. The data relating to real estate displayed on this display comes in part from the IDX Program of PrimeMLS. The information being provided is for consumers’ personal, non-commercial use and may not be used for any purpose other than to identify prospective properties consumers may be interested in purchasing.
Copyright 2025 PrimeMLS, Inc. All rights reserved. This information is deemed reliable, but not guaranteed. The data relating to real estate displayed on this display comes in part from the IDX Program of PrimeMLS. The information being provided is for consumers’ personal, non-commercial use and may not be used for any purpose other than to identify prospective properties consumers may be interested in purchasing.
Nearby Homes
- 121 Palm St
- 111 Ash St
- 8 Nevada St
- 22 Gilman St
- 59-61 Kinsley St
- 32 Hanover St
- 32 Blossom St Unit 321/2
- 36 Ross St
- 146 1/2 Chestnut St
- 22 Pierce St
- 69 Ash St
- 75-77 Chestnut St
- 12 Badger St
- 7 Hanover St
- 15 Lovell St Unit 10
- 27 Beech St Unit 54
- 11-13 Bridle Path
- 5 Mulberry St
- 24 - 24.5 Cedar St
- 26 Verona St Unit 176