Estimated Value: $185,989 - $223,000
--
Bed
1
Bath
1,979
Sq Ft
$104/Sq Ft
Est. Value
About This Home
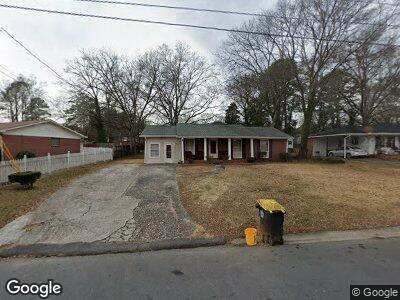
This home is located at 110 Penncrest Dr NE, Rome, GA 30161 and is currently estimated at $206,497, approximately $104 per square foot. 110 Penncrest Dr NE is a home located in Floyd County with nearby schools including Rome High School, Unity Christian School, and Unity Christian School.
Ownership History
Date
Name
Owned For
Owner Type
Purchase Details
Closed on
Sep 29, 1993
Sold by
Lee Harry and Carolyn Lee
Bought by
Mcclure Donnie D and Mcclure Andrea R
Current Estimated Value
Purchase Details
Closed on
Jul 29, 1983
Sold by
Walker Larry B and Walker Vicki J
Bought by
Lee Harry and Carolyn Lee
Purchase Details
Closed on
Aug 14, 1975
Bought by
P and R
Purchase Details
Closed on
Mar 5, 1975
Sold by
Anderson John M and Anderson Robin F
Bought by
Walker Larry B and Walker Vicki J
Purchase Details
Closed on
Nov 1, 1974
Sold by
Newman Roy N
Bought by
Anderson John M and Anderson Robin F
Purchase Details
Closed on
Oct 3, 1974
Bought by
P and R
Purchase Details
Closed on
Nov 25, 1964
Sold by
Davis Clyde R Builders Inc
Bought by
Canada Tommie and Mrs Linda
Purchase Details
Closed on
Sep 23, 1964
Bought by
P and R
Purchase Details
Closed on
Jan 1, 1950
Sold by
Hitchcock Lillian Lam
Bought by
Hitchcock Lillian Lam
Purchase Details
Closed on
Jan 1, 1901
Bought by
Hitchcock Lillian Lam
Create a Home Valuation Report for This Property
The Home Valuation Report is an in-depth analysis detailing your home's value as well as a comparison with similar homes in the area
Home Values in the Area
Average Home Value in this Area
Purchase History
| Date | Buyer | Sale Price | Title Company |
|---|---|---|---|
| Mcclure Donnie D | $49,500 | -- | |
| Lee Harry | $33,000 | -- | |
| P | -- | -- | |
| Walker Larry B | $24,400 | -- | |
| Anderson John M | -- | -- | |
| P | -- | -- | |
| Newman Roy N | -- | -- | |
| Canada Tommie | -- | -- | |
| P | -- | -- | |
| Davis Clyde R Builders Inc | $13,900 | -- | |
| Hitchcock Lillian Lam | -- | -- | |
| Hitchcock Lillian Lam | -- | -- |
Source: Public Records
Tax History Compared to Growth
Tax History
| Year | Tax Paid | Tax Assessment Tax Assessment Total Assessment is a certain percentage of the fair market value that is determined by local assessors to be the total taxable value of land and additions on the property. | Land | Improvement |
|---|---|---|---|---|
| 2024 | $1,639 | $60,677 | $5,440 | $55,237 |
| 2023 | $1,579 | $57,522 | $4,800 | $52,722 |
| 2022 | $1,560 | $53,235 | $3,840 | $49,395 |
| 2021 | $1,397 | $42,725 | $3,840 | $38,885 |
| 2020 | $1,345 | $39,142 | $2,880 | $36,262 |
| 2019 | $1,287 | $36,518 | $2,880 | $33,638 |
| 2018 | $1,208 | $33,920 | $2,880 | $31,040 |
| 2017 | $1,151 | $32,363 | $2,880 | $29,483 |
| 2016 | $1,113 | $31,264 | $2,880 | $28,384 |
| 2015 | $1,071 | $31,794 | $2,880 | $28,914 |
| 2014 | $1,071 | $31,794 | $2,880 | $28,914 |
Source: Public Records
Map
Nearby Homes
- 112 E Valley Rd NE
- 127 Jim Lee Dr NE
- 3 Hillcrest Ave NE
- 507 Superba Ave NE
- 113 Northwood Dr NE
- 206 Church St NE
- 10 Forest Ln NE
- 209 Church St NE
- 33 Berkshire Dr NE
- 413 Stonewall St NE
- 7 Berkshire Ln NE
- 0 Georgia 293
- 4 Highland St NE
- 313 Kingston Ave NE
- 307 Kingston Ave NE
- 312 Perkins St NE
- 304 Perkins St NE
- 110 Penncrest Dr NE
- 108 Penncrest Dr NE
- 112 Penncrest Dr NE
- 23 Atteiram Dr NE
- 106 Penncrest Dr NE
- 25 Atteiram Dr NE
- 109 Penncrest Dr NE
- 21 Atteiram Dr NE
- 111 Penncrest Dr NE
- 100 Jim Lee Dr NE
- 0 Jim Lee Dr Drne Dr
- 100 Jim Lee Dr Drne Dr
- 100 Jim Lee Dr NE Unit NE
- 104 Penncrest Dr NE
- 102 Atteiram Dr NE
- 19 Atteiram Dr NE
- 107 Atteiram Dr NE
- 100 Atteiram Dr NE
- 104 Atteiram Dr NE
- 102 Jim Lee Dr NE