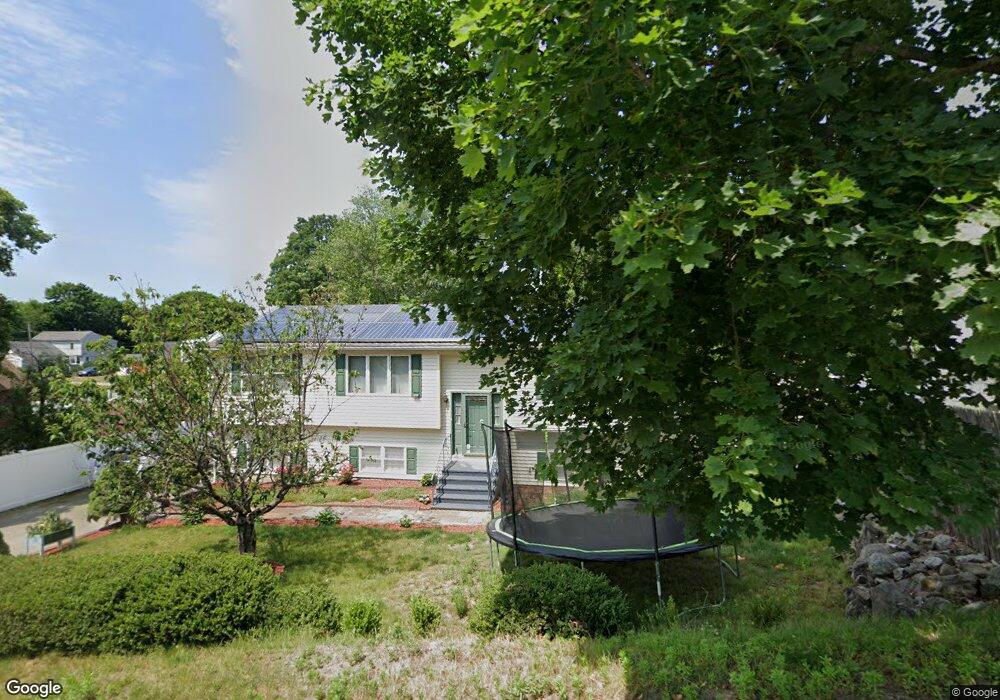
110 Pine View Ave Worcester, MA 01603
Hadwen Park NeighborhoodEstimated Value: $338,000 - $493,000
3
Beds
3
Baths
1,182
Sq Ft
$369/Sq Ft
Est. Value
About This Home
This home is located at 110 Pine View Ave, Worcester, MA 01603 and is currently estimated at $436,333, approximately $369 per square foot. 110 Pine View Ave is a home located in Worcester County with nearby schools including Jacob Hiatt Magnet School, Chandler Magnet, and Heard Street Discovery Academy.
Ownership History
Date
Name
Owned For
Owner Type
Purchase Details
Closed on
Jul 23, 2004
Sold by
Nguyen Bich N and Vo Quang V
Bought by
Van-Tran Vu
Current Estimated Value
Home Financials for this Owner
Home Financials are based on the most recent Mortgage that was taken out on this home.
Original Mortgage
$267,097
Interest Rate
6.28%
Mortgage Type
Purchase Money Mortgage
Purchase Details
Closed on
Jan 15, 1998
Sold by
Marshall Terence T and Marshall Wendy A
Bought by
Vo Quang
Home Financials for this Owner
Home Financials are based on the most recent Mortgage that was taken out on this home.
Original Mortgage
$89,600
Interest Rate
7.08%
Mortgage Type
Purchase Money Mortgage
Purchase Details
Closed on
Oct 4, 1994
Sold by
Firmes Anne M
Bought by
Marshall Terence T and Marshall Wendy A
Create a Home Valuation Report for This Property
The Home Valuation Report is an in-depth analysis detailing your home's value as well as a comparison with similar homes in the area
Home Values in the Area
Average Home Value in this Area
Purchase History
| Date | Buyer | Sale Price | Title Company |
|---|---|---|---|
| Van-Tran Vu | $277,000 | -- | |
| Vo Quang | $112,000 | -- | |
| Marshall Terence T | $28,000 | -- |
Source: Public Records
Mortgage History
| Date | Status | Borrower | Loan Amount |
|---|---|---|---|
| Open | Marshall Terence T | $252,561 | |
| Closed | Marshall Terence T | $258,983 | |
| Closed | Van-Tran Vu | $267,097 | |
| Previous Owner | Marshall Terence T | $89,600 |
Source: Public Records
Tax History
| Year | Tax Paid | Tax Assessment Tax Assessment Total Assessment is a certain percentage of the fair market value that is determined by local assessors to be the total taxable value of land and additions on the property. | Land | Improvement |
|---|---|---|---|---|
| 2025 | $5,494 | $416,500 | $97,600 | $318,900 |
| 2024 | $5,330 | $387,600 | $97,600 | $290,000 |
| 2023 | $5,223 | $364,200 | $84,900 | $279,300 |
| 2022 | $4,540 | $298,500 | $67,900 | $230,600 |
| 2021 | $4,514 | $277,300 | $54,300 | $223,000 |
| 2020 | $4,330 | $254,700 | $53,900 | $200,800 |
| 2019 | $4,205 | $233,600 | $47,100 | $186,500 |
| 2018 | $4,215 | $222,900 | $47,100 | $175,800 |
| 2017 | $3,761 | $195,700 | $47,100 | $148,600 |
| 2016 | $3,724 | $180,700 | $33,300 | $147,400 |
| 2015 | $3,627 | $180,700 | $33,300 | $147,400 |
| 2014 | $3,531 | $180,700 | $33,300 | $147,400 |
Source: Public Records
Map
Nearby Homes
- 99 Clover St
- 35 Genessee St Unit E
- 11 Hulbert Rd Unit 13
- 103 Henshaw St
- 27 Havana Rd
- 5 Commonwealth Ave
- 55 Grandview Ave
- 315 Stafford St
- 25 Vinal St Unit 28
- 25 Vinal St Unit 26
- 25 Vinal St Unit 29
- 25 Vinal St Unit 30
- 26 Sylvan St
- 32 Goddard Memorial Dr
- 13 Merchant St
- 177 Oxford St N
- 2 Montague St
- 56 Goddard Memorial Dr
- 1511 Main St Unit C405
- 27 Montague St
- 186 Clover St
- 40 Laurier St
- 196 Clover St
- 25 Saint Kevin Rd
- 36 Laurier St
- 200 Clover St
- 176 Clover St
- 109 Pine View Ave
- 204 Clover St
- 32 Laurier St
- 187 Clover St
- 21 Saint Kevin Rd
- 104 Pine View Ave
- 30 Laurier St
- 17 Papineau St
- 20 Saint Kevin Rd
- 208 Clover St
- 35 Laurier St
- 174 Clover St
- 1 Montello St
Your Personal Tour Guide
Ask me questions while you tour the home.