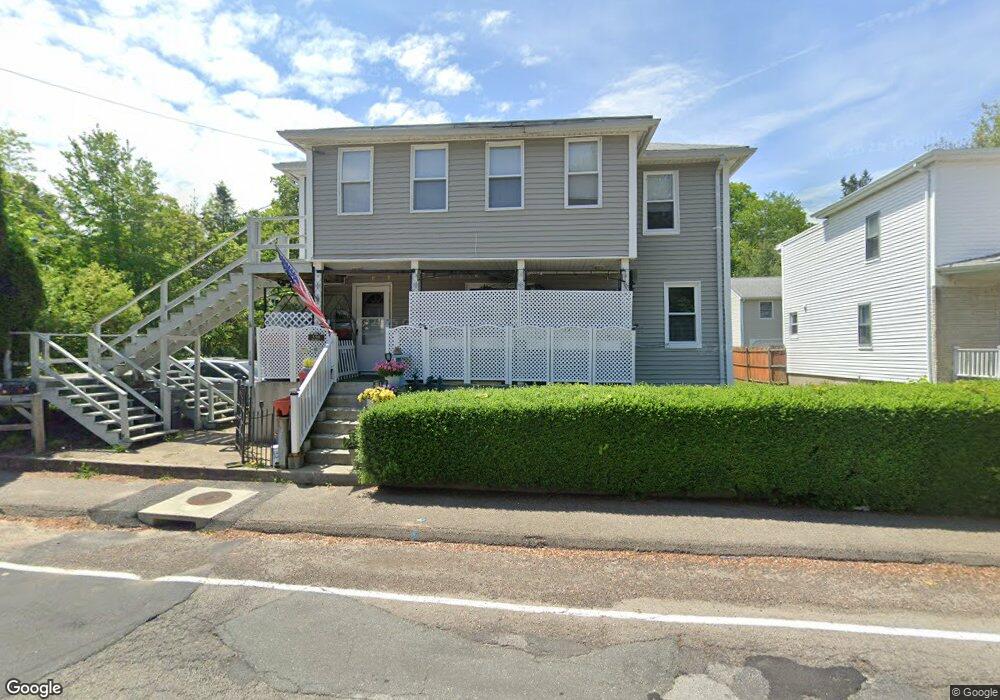
110 Read Ave Coventry, RI 02816
West Warwick Centre NeighborhoodEstimated Value: $452,000 - $531,737
4
Beds
3
Baths
2,018
Sq Ft
$239/Sq Ft
Est. Value
About This Home
This home is located at 110 Read Ave, Coventry, RI 02816 and is currently estimated at $482,184, approximately $238 per square foot. 110 Read Ave is a home located in Kent County with nearby schools including Alan Shawn Feinstein Ms Of Cov and Coventry High School.
Ownership History
Date
Name
Owned For
Owner Type
Purchase Details
Closed on
Aug 14, 1997
Sold by
Coletta Mark R and Coletta Alissa
Bought by
Martin Glenn A and Montero Barbara J
Current Estimated Value
Home Financials for this Owner
Home Financials are based on the most recent Mortgage that was taken out on this home.
Original Mortgage
$100,000
Interest Rate
7.56%
Purchase Details
Closed on
Sep 5, 1990
Sold by
Lebrun Arthur
Bought by
Coletta Mark
Home Financials for this Owner
Home Financials are based on the most recent Mortgage that was taken out on this home.
Original Mortgage
$110,000
Interest Rate
9.83%
Create a Home Valuation Report for This Property
The Home Valuation Report is an in-depth analysis detailing your home's value as well as a comparison with similar homes in the area
Home Values in the Area
Average Home Value in this Area
Purchase History
| Date | Buyer | Sale Price | Title Company |
|---|---|---|---|
| Martin Glenn A | $125,000 | -- | |
| Coletta Mark | $125,000 | -- |
Source: Public Records
Mortgage History
| Date | Status | Borrower | Loan Amount |
|---|---|---|---|
| Open | Coletta Mark | $96,500 | |
| Closed | Coletta Mark | $100,000 | |
| Previous Owner | Coletta Mark | $86,300 | |
| Previous Owner | Coletta Mark | $110,000 |
Source: Public Records
Tax History
| Year | Tax Paid | Tax Assessment Tax Assessment Total Assessment is a certain percentage of the fair market value that is determined by local assessors to be the total taxable value of land and additions on the property. | Land | Improvement |
|---|---|---|---|---|
| 2025 | $4,870 | $302,700 | $91,300 | $211,400 |
| 2024 | $4,795 | $302,700 | $91,300 | $211,400 |
| 2023 | $4,640 | $302,700 | $91,300 | $211,400 |
| 2022 | $5,309 | $271,300 | $87,300 | $184,000 |
| 2021 | $5,003 | $257,900 | $87,300 | $170,600 |
| 2020 | $5,720 | $257,200 | $87,300 | $169,900 |
| 2019 | $4,421 | $198,800 | $73,400 | $125,400 |
| 2018 | $4,296 | $198,800 | $73,400 | $125,400 |
| 2017 | $4,171 | $198,800 | $73,400 | $125,400 |
| 2016 | $4,057 | $189,500 | $69,400 | $120,100 |
| 2015 | $3,947 | $189,500 | $69,400 | $120,100 |
| 2014 | $3,865 | $189,500 | $69,400 | $120,100 |
| 2013 | $3,583 | $192,000 | $71,300 | $120,700 |
Source: Public Records
Map
Nearby Homes
Your Personal Tour Guide
Ask me questions while you tour the home.