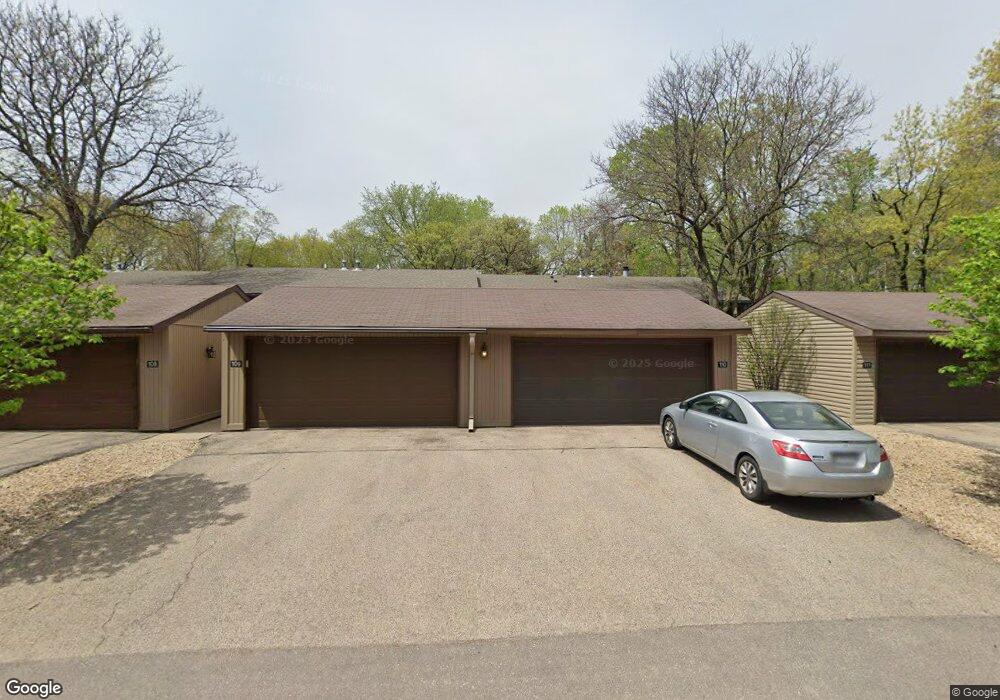
110 River Woods Ln Burnsville, MN 55337
Estimated Value: $233,227 - $255,000
3
Beds
2
Baths
762
Sq Ft
$320/Sq Ft
Est. Value
About This Home
This home is located at 110 River Woods Ln, Burnsville, MN 55337 and is currently estimated at $243,807, approximately $319 per square foot. 110 River Woods Ln is a home located in Dakota County with nearby schools including William Byrne Elementary School, Burnsville High School, and Gateway STEM Academy.
Ownership History
Date
Name
Owned For
Owner Type
Purchase Details
Closed on
Jun 1, 2020
Sold by
Chapman Daniel W
Bought by
Sorenson Shelby and Kane Taylor Z
Current Estimated Value
Home Financials for this Owner
Home Financials are based on the most recent Mortgage that was taken out on this home.
Original Mortgage
$181,875
Outstanding Balance
$161,218
Interest Rate
3.2%
Mortgage Type
New Conventional
Estimated Equity
$82,589
Purchase Details
Closed on
Aug 31, 2010
Sold by
Burtsev Libby and Burtsev Andre
Bought by
Chapman Daniel W
Home Financials for this Owner
Home Financials are based on the most recent Mortgage that was taken out on this home.
Original Mortgage
$129,851
Interest Rate
4.25%
Mortgage Type
FHA
Purchase Details
Closed on
Nov 2, 2007
Sold by
Jpmorgan Chase Bank
Bought by
Burtsev Libby
Purchase Details
Closed on
Oct 16, 2003
Sold by
Ogithjda Mukwa O Tilsen and Marable Jennefer
Bought by
Gebhart Kevin and Gebhart Sandra
Purchase Details
Closed on
Apr 8, 2002
Sold by
Mcgaha John R and Mcgaha Olivia
Bought by
Ogitchida Mukwa O and Tilsen Judith M
Purchase Details
Closed on
Aug 26, 1999
Sold by
Olson Kristin A
Bought by
Mcgaha John R
Create a Home Valuation Report for This Property
The Home Valuation Report is an in-depth analysis detailing your home's value as well as a comparison with similar homes in the area
Home Values in the Area
Average Home Value in this Area
Purchase History
| Date | Buyer | Sale Price | Title Company |
|---|---|---|---|
| Sorenson Shelby | $187,500 | Titlesmart Inc | |
| Chapman Daniel W | $131,600 | -- | |
| Burtsev Libby | $116,000 | -- | |
| Gebhart Kevin | $159,500 | -- | |
| Ogitchida Mukwa O | $142,000 | -- | |
| Mcgaha John R | $105,000 | -- |
Source: Public Records
Mortgage History
| Date | Status | Borrower | Loan Amount |
|---|---|---|---|
| Open | Sorenson Shelby | $181,875 | |
| Previous Owner | Chapman Daniel W | $129,851 |
Source: Public Records
Tax History Compared to Growth
Tax History
| Year | Tax Paid | Tax Assessment Tax Assessment Total Assessment is a certain percentage of the fair market value that is determined by local assessors to be the total taxable value of land and additions on the property. | Land | Improvement |
|---|---|---|---|---|
| 2024 | $2,262 | $221,800 | $37,000 | $184,800 |
| 2023 | $2,262 | $228,000 | $37,100 | $190,900 |
| 2022 | $2,090 | $221,400 | $37,000 | $184,400 |
| 2021 | $1,816 | $194,000 | $32,200 | $161,800 |
| 2020 | $2,476 | $177,000 | $30,700 | $146,300 |
| 2019 | $2,673 | $164,700 | $29,200 | $135,500 |
| 2018 | $2,749 | $162,800 | $27,000 | $135,800 |
| 2017 | $3,199 | $147,000 | $25,000 | $122,000 |
| 2016 | $2,505 | $139,400 | $23,800 | $115,600 |
| 2015 | $1,712 | $99,119 | $18,303 | $80,816 |
| 2014 | -- | $89,963 | $16,728 | $73,235 |
| 2013 | -- | $73,286 | $13,949 | $59,337 |
Source: Public Records
Map
Nearby Homes
- 145 River Woods Ln
- 72 River Woods Ln
- 146 River Woods Ln
- 55 River Woods Ln
- 319 River Woods Ln
- 221 River Woods Ln
- 188 River Woods Ln
- 247 River Woods Ln
- 11921 Baypoint Dr
- 3309 Red Oak Cir N
- 11902 River Hills Cir
- 12625 Sable Dr
- 2400 E 125th St
- 2300 Villaburne Ct W
- 11900 Highland View Cir
- 12232 Oak Leaf Cir
- 4632 Westwood Ln
- 4774 Slater Rd
- 12640 Tiffany Ct
- 2005 E 122nd St Unit A7
- 109 River Woods Ln
- 111 River Woods Ln
- 108 River Woods Ln
- 107 River Woods Ln
- 106 River Woods Ln
- 114 River Woods Ln
- 113 River Woods Ln
- 115 River Woods Ln
- 112 River Woods Ln
- 116 River Woods Ln
- 117 River Woods Ln
- 99 River Woods Ln
- 105 River Woods Ln
- 98 River Woods Ln
- 104 River Woods Ln
- 103 River Woods Ln
- 97 River Woods Ln
- 102 River Woods Ln
- 96 River Woods Ln
- 129 River Woods Ln