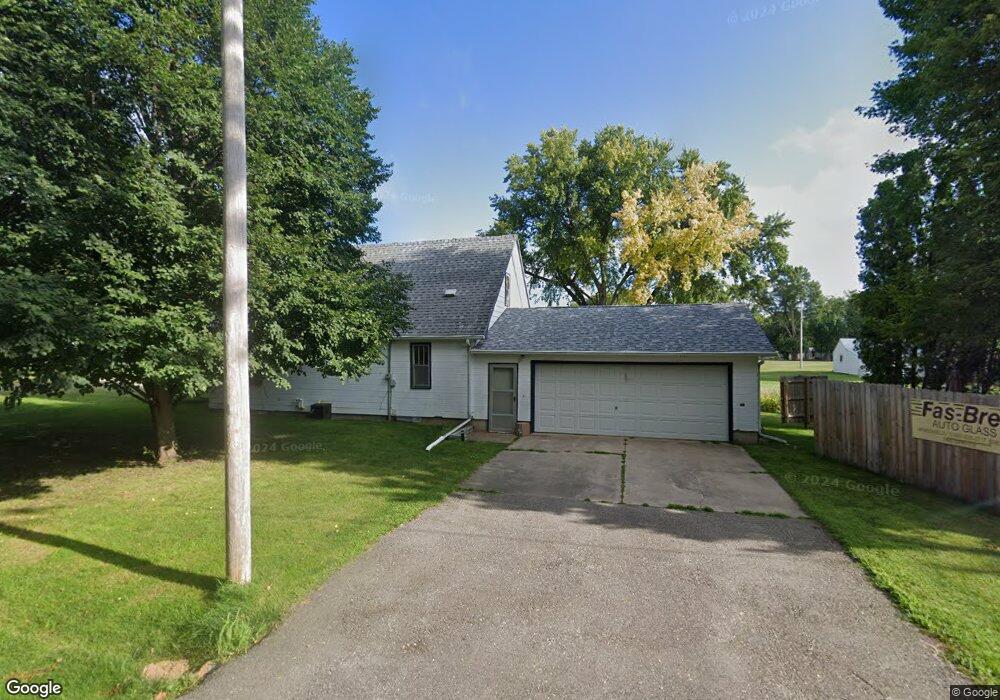
110 S 3rd St Terril, IA 51364
Estimated Value: $102,000 - $124,401
3
Beds
1
Bath
1,102
Sq Ft
$105/Sq Ft
Est. Value
About This Home
This home is located at 110 S 3rd St, Terril, IA 51364 and is currently estimated at $115,467, approximately $104 per square foot. 110 S 3rd St is a home with nearby schools including Graettinger-Terril Elementary School, Graettinger-Terril High School, and Graettinger-Terril Middle School.
Ownership History
Date
Name
Owned For
Owner Type
Purchase Details
Closed on
May 24, 2011
Sold by
Nelson Mary C and Nelson Roger
Bought by
Soat Ronald R
Current Estimated Value
Purchase Details
Closed on
Oct 30, 2006
Sold by
Nelson Mary C and Nelson Roger
Bought by
Soat Ronald R
Home Financials for this Owner
Home Financials are based on the most recent Mortgage that was taken out on this home.
Original Mortgage
$33,200
Interest Rate
6.5%
Mortgage Type
New Conventional
Create a Home Valuation Report for This Property
The Home Valuation Report is an in-depth analysis detailing your home's value as well as a comparison with similar homes in the area
Home Values in the Area
Average Home Value in this Area
Purchase History
| Date | Buyer | Sale Price | Title Company |
|---|---|---|---|
| Soat Ronald R | $41,500 | None Available | |
| Soat Ronald R | -- | None Available |
Source: Public Records
Mortgage History
| Date | Status | Borrower | Loan Amount |
|---|---|---|---|
| Previous Owner | Soat Ronald R | $33,200 |
Source: Public Records
Tax History Compared to Growth
Tax History
| Year | Tax Paid | Tax Assessment Tax Assessment Total Assessment is a certain percentage of the fair market value that is determined by local assessors to be the total taxable value of land and additions on the property. | Land | Improvement |
|---|---|---|---|---|
| 2025 | $898 | $88,300 | $4,200 | $84,100 |
| 2024 | $898 | $66,600 | $3,400 | $63,200 |
| 2023 | $840 | $66,600 | $3,400 | $63,200 |
| 2022 | $816 | $53,100 | $1,900 | $51,200 |
| 2021 | $816 | $53,100 | $1,900 | $51,200 |
| 2020 | $646 | $44,700 | $1,700 | $43,000 |
| 2019 | $580 | $44,700 | $1,700 | $43,000 |
| 2018 | $582 | $39,200 | $1,500 | $37,700 |
| 2017 | $582 | $39,200 | $1,500 | $37,700 |
| 2016 | $588 | $39,800 | $1,500 | $38,300 |
| 2015 | $574 | $39,800 | $1,500 | $38,300 |
| 2014 | $604 | $42,200 | $1,800 | $40,400 |
| 2013 | $570 | $42,200 | $1,800 | $40,400 |
Source: Public Records
Map
Nearby Homes