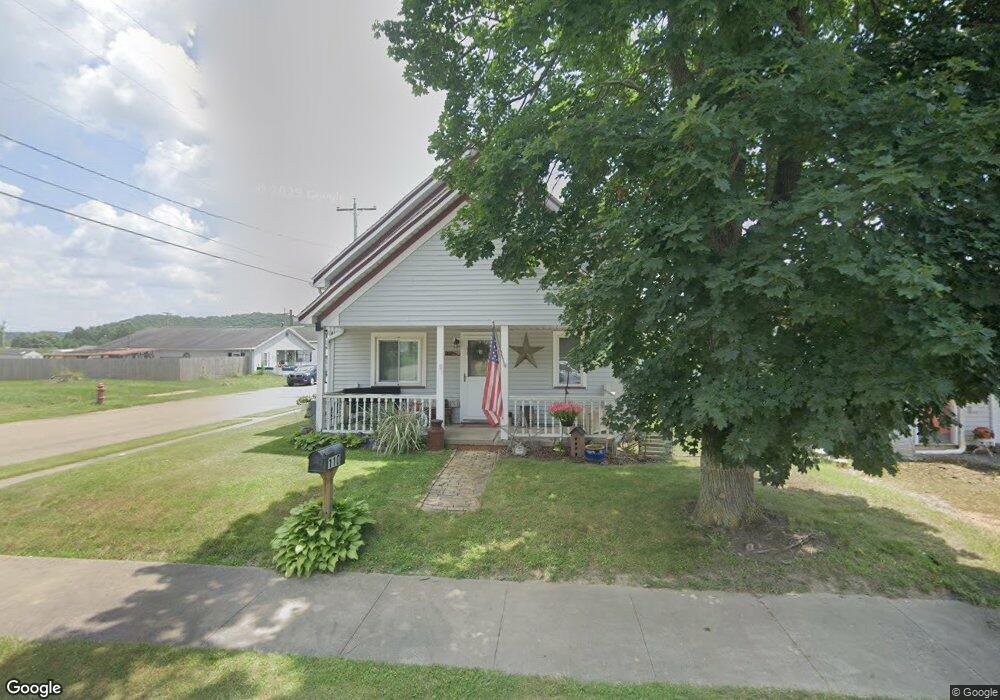
110 S 7th St Dennison, OH 44621
Estimated Value: $103,000 - $145,000
3
Beds
1
Bath
1,112
Sq Ft
$107/Sq Ft
Est. Value
About This Home
This home is located at 110 S 7th St, Dennison, OH 44621 and is currently estimated at $119,237, approximately $107 per square foot. 110 S 7th St is a home located in Tuscarawas County with nearby schools including Claymont High School and Immaculate Conception School.
Ownership History
Date
Name
Owned For
Owner Type
Purchase Details
Closed on
Jul 27, 2009
Sold by
Hudnall Robert L and Hudnall Robert
Bought by
Hudnall Linda J
Current Estimated Value
Home Financials for this Owner
Home Financials are based on the most recent Mortgage that was taken out on this home.
Original Mortgage
$58,400
Outstanding Balance
$38,502
Interest Rate
5.43%
Mortgage Type
New Conventional
Estimated Equity
$80,735
Purchase Details
Closed on
Oct 11, 1991
Sold by
Bonifay Charles R and Bonifay Alberta J
Bought by
Hudnall Robert L and Hudnall Linda J
Create a Home Valuation Report for This Property
The Home Valuation Report is an in-depth analysis detailing your home's value as well as a comparison with similar homes in the area
Home Values in the Area
Average Home Value in this Area
Purchase History
| Date | Buyer | Sale Price | Title Company |
|---|---|---|---|
| Hudnall Linda J | -- | Alban Title | |
| Hudnall Robert L | $14,000 | -- |
Source: Public Records
Mortgage History
| Date | Status | Borrower | Loan Amount |
|---|---|---|---|
| Open | Hudnall Linda J | $58,400 |
Source: Public Records
Tax History Compared to Growth
Tax History
| Year | Tax Paid | Tax Assessment Tax Assessment Total Assessment is a certain percentage of the fair market value that is determined by local assessors to be the total taxable value of land and additions on the property. | Land | Improvement |
|---|---|---|---|---|
| 2024 | $783 | $21,490 | $2,460 | $19,030 |
| 2023 | $783 | $61,410 | $7,030 | $54,380 |
| 2022 | $783 | $21,494 | $2,461 | $19,033 |
| 2021 | $691 | $17,693 | $1,589 | $16,104 |
| 2020 | $703 | $17,630 | $1,589 | $16,041 |
| 2019 | $672 | $17,630 | $1,589 | $16,041 |
| 2018 | $611 | $14,870 | $1,340 | $13,530 |
| 2017 | $628 | $14,870 | $1,340 | $13,530 |
| 2016 | $624 | $14,870 | $1,340 | $13,530 |
| 2014 | $643 | $15,230 | $1,580 | $13,650 |
| 2013 | $643 | $15,230 | $1,580 | $13,650 |
Source: Public Records
Map
Nearby Homes