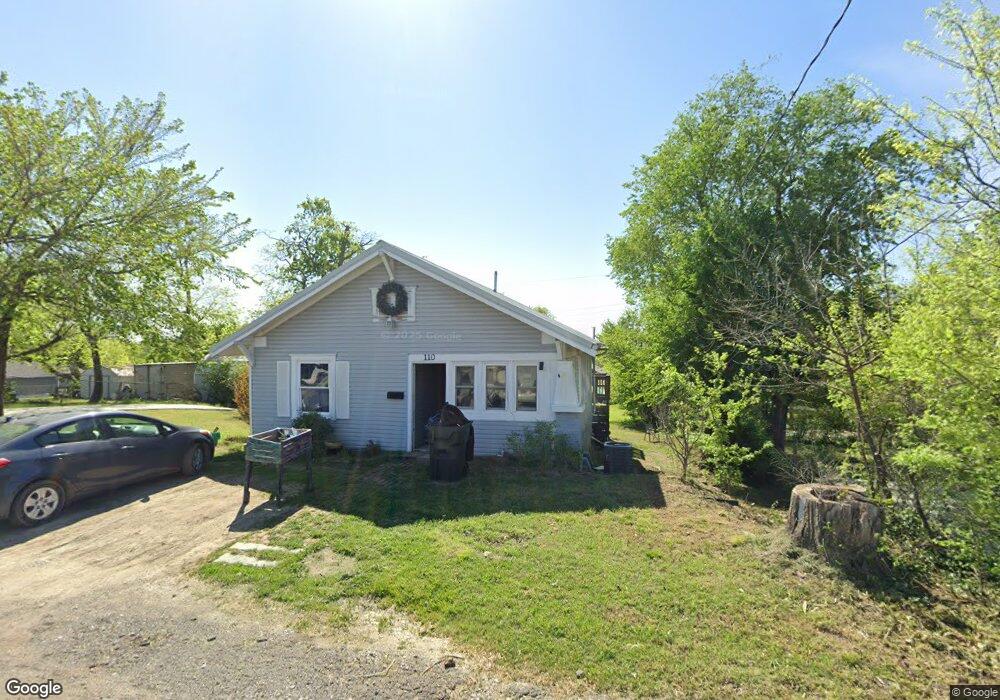
110 S Cedar St Sapulpa, OK 74066
Estimated Value: $141,000 - $186,000
3
Beds
2
Baths
1,135
Sq Ft
$141/Sq Ft
Est. Value
About This Home
This home is located at 110 S Cedar St, Sapulpa, OK 74066 and is currently estimated at $160,065, approximately $141 per square foot. 110 S Cedar St is a home located in Creek County with nearby schools including Sapulpa Junior High School, Sapulpa Middle School, and Sapulpa High School.
Ownership History
Date
Name
Owned For
Owner Type
Purchase Details
Closed on
Jul 8, 2019
Sold by
Gateway Mortgage Group Llc
Bought by
Jcmb Rental Properties Llc
Current Estimated Value
Purchase Details
Closed on
Jun 20, 2019
Sold by
Jones Christopher David and Jones Misty
Bought by
Gateway Mortgage Group Llc
Purchase Details
Closed on
Oct 16, 2013
Sold by
Sherman Todd Phillip and Sherman Rhonda Elizabeth
Bought by
Jones Christopher David and Jones Misty
Home Financials for this Owner
Home Financials are based on the most recent Mortgage that was taken out on this home.
Original Mortgage
$93,279
Interest Rate
4.75%
Mortgage Type
FHA
Purchase Details
Closed on
Sep 8, 2008
Sold by
Sherman Todd Phillip
Bought by
Sherman Todd Phillip and Sherman Rhonda Elizabeth
Create a Home Valuation Report for This Property
The Home Valuation Report is an in-depth analysis detailing your home's value as well as a comparison with similar homes in the area
Home Values in the Area
Average Home Value in this Area
Purchase History
| Date | Buyer | Sale Price | Title Company |
|---|---|---|---|
| Jcmb Rental Properties Llc | $32,500 | None Available | |
| Gateway Mortgage Group Llc | $86,550 | None Available | |
| Jones Christopher David | $95,000 | American Abstract & Title Co | |
| Sherman Todd Phillip | -- | None Available |
Source: Public Records
Mortgage History
| Date | Status | Borrower | Loan Amount |
|---|---|---|---|
| Previous Owner | Jones Christopher David | $93,279 |
Source: Public Records
Tax History Compared to Growth
Tax History
| Year | Tax Paid | Tax Assessment Tax Assessment Total Assessment is a certain percentage of the fair market value that is determined by local assessors to be the total taxable value of land and additions on the property. | Land | Improvement |
|---|---|---|---|---|
| 2025 | $1,200 | $10,363 | $2,040 | $8,323 |
| 2024 | $1,200 | $9,869 | $2,040 | $7,829 |
| 2023 | $1,200 | $9,400 | $2,040 | $7,360 |
| 2022 | $1,028 | $8,952 | $2,040 | $6,912 |
| 2021 | $1,062 | $8,952 | $2,040 | $6,912 |
| 2020 | $1,088 | $9,226 | $2,040 | $7,186 |
| 2019 | $1,457 | $12,288 | $1,180 | $11,108 |
| 2018 | $1,416 | $11,703 | $1,020 | $10,683 |
| 2017 | $1,409 | $11,703 | $1,020 | $10,683 |
| 2016 | $1,339 | $11,703 | $1,020 | $10,683 |
| 2015 | -- | $11,703 | $1,020 | $10,683 |
| 2014 | -- | $11,703 | $1,020 | $10,683 |
Source: Public Records
Map
Nearby Homes
- 131 S Hickory St
- 139 S Hickory St
- 310 W Lee Ave
- 206 S Mounds St
- 14 S Mounds St
- 303 W Mckinley Ave
- 111 S Poplar St
- 314 S Poplar St
- 404 S Hickory St
- 115 N Mounds St
- 317 S Poplar St
- 321 W Bryan Ave
- 410 S Poplar St
- 508 S Hickory St
- 210 S Water St
- 408 S Muskogee St
- 208 N Burnett St
- 609 S Poplar St
- 637 S Mounds St
- 706 S Oklahoma St
- 120 S Cedar St
- 117 S Hickory St
- 119 S Hickory St
- 111 S Cedar St
- 236 W Lee Ave
- 123 S Hickory St
- 322 W Lee Ave
- 105 S Hickory St
- 127 S Cedar St
- 230 W Lee Ave
- 326 W Lee Ave
- 130 S Cedar St
- 102 S Hickory St
- 220 W Lee Ave
- 138 S Cedar St
- 118 S Hickory St
- 122 S Hickory St
- 303 W Lee Ave
- 122 S Mounds St
- 108 S Hickory St