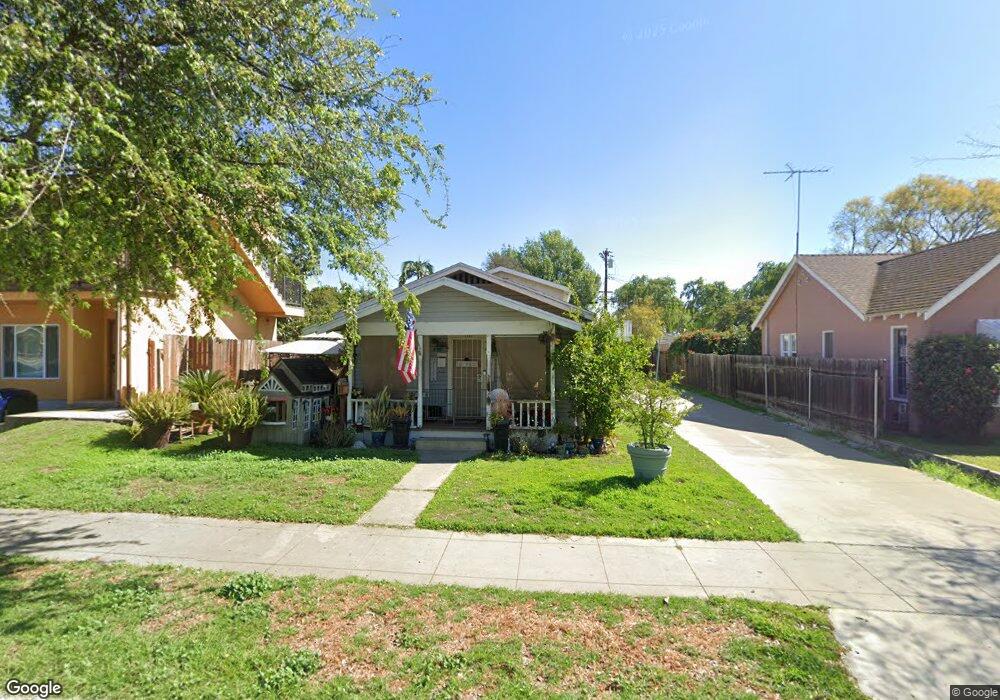
110 S Cornell Ave Fullerton, CA 92831
Estimated Value: $818,000 - $947,000
2
Beds
1
Bath
820
Sq Ft
$1,061/Sq Ft
Est. Value
About This Home
This home is located at 110 S Cornell Ave, Fullerton, CA 92831 and is currently estimated at $870,059, approximately $1,061 per square foot. 110 S Cornell Ave is a home located in Orange County with nearby schools including Raymond Elementary School, Ladera Vista Junior High School, and Fullerton Union High School.
Ownership History
Date
Name
Owned For
Owner Type
Purchase Details
Closed on
Nov 21, 2002
Sold by
Mihele Horatio Cosmin
Bought by
Mihele Amy Dawn
Current Estimated Value
Purchase Details
Closed on
Jun 26, 1998
Sold by
Holborn Ronald and Holborn Stephanie Mae
Bought by
Mihele Horatio Cosmin and Mihele Amy Dawn
Home Financials for this Owner
Home Financials are based on the most recent Mortgage that was taken out on this home.
Original Mortgage
$125,104
Interest Rate
6.88%
Mortgage Type
FHA
Purchase Details
Closed on
Apr 29, 1998
Sold by
Kelly Patricia M and Kelly Frankie S
Bought by
Holborn Ronald and Holborn Stephanie Mae
Home Financials for this Owner
Home Financials are based on the most recent Mortgage that was taken out on this home.
Original Mortgage
$125,104
Interest Rate
6.88%
Mortgage Type
FHA
Purchase Details
Closed on
Jun 9, 1994
Sold by
Kelly Patrick M and Kelly Frankie S
Bought by
Kelly Patrick M and Kelly Frankie S
Create a Home Valuation Report for This Property
The Home Valuation Report is an in-depth analysis detailing your home's value as well as a comparison with similar homes in the area
Purchase History
| Date | Buyer | Sale Price | Title Company |
|---|---|---|---|
| Mihele Amy Dawn | -- | Investors Title Company | |
| Mihele Amy Dawn | -- | Investors Title Company | |
| Mihele Horatio Cosmin | $126,000 | North American Title Co | |
| Holborn Ronald | $92,000 | North American Title Co | |
| Kelly Patrick M | -- | -- |
Source: Public Records
Mortgage History
| Date | Status | Borrower | Loan Amount |
|---|---|---|---|
| Previous Owner | Mihele Horatio Cosmin | $125,104 | |
| Previous Owner | Holborn Ronald | $73,600 |
Source: Public Records
Tax History
| Year | Tax Paid | Tax Assessment Tax Assessment Total Assessment is a certain percentage of the fair market value that is determined by local assessors to be the total taxable value of land and additions on the property. | Land | Improvement |
|---|---|---|---|---|
| 2025 | $4,336 | $377,135 | $173,547 | $203,588 |
| 2024 | $4,336 | $369,741 | $170,144 | $199,597 |
| 2023 | $4,230 | $362,492 | $166,808 | $195,684 |
| 2022 | $4,200 | $355,385 | $163,537 | $191,848 |
| 2021 | $4,128 | $348,417 | $160,330 | $188,087 |
| 2020 | $4,104 | $344,845 | $158,686 | $186,159 |
| 2019 | $4,001 | $338,084 | $155,575 | $182,509 |
| 2018 | $3,942 | $331,455 | $152,524 | $178,931 |
| 2017 | $3,877 | $324,956 | $149,533 | $175,423 |
| 2016 | $3,797 | $318,585 | $146,601 | $171,984 |
| 2015 | $3,693 | $313,800 | $144,399 | $169,401 |
| 2014 | $3,588 | $307,654 | $141,571 | $166,083 |
Source: Public Records
Map
Nearby Homes
- 1105 E Walnut Ave
- 111 N Stanford Ave
- 151 N Lincoln Ave
- 705 E Santa fe Ave
- 16 Magnolia Viaduct
- 13 Palm Viaduct
- 501 E Orangethorpe Ave Unit 31
- 34 Pine Viaduct
- 7 Pine Viaduct
- 1318 Victoria Dr Unit B
- 47 Fir Viaduct
- 1330 Victoria Dr Unit C
- 436 E Elm Ave
- 1245 Riverside Dr
- 1001 Nutwood Ave
- 35 Orange Viaduct
- 1740 E Commonwealth Ave Unit 101
- 804 E Glenwood Ave
- 37 Elm Viaduct
- 1736 E Commonwealth Ave Unit 102
- 114 S Cornell Ave
- 1006 E Commonwealth Ave
- 1000 E Commonwealth Ave
- 1010 E Commonwealth Ave
- 118 S Cornell Ave
- 1014 E Commonwealth Ave
- 1002 E Commonwealth Ave
- 122 S Cornell Ave
- 922 E Commonwealth Ave
- 1101 Sudene Ave
- 111 S Cornell Ave
- 115 S Cornell Ave
- 916 E Commonwealth Ave
- 126 S Cornell Ave
- 119 S Cornell Ave
- 1102 E Commonwealth Ave
- 1100 Sudene Ave
- 1103 Sudene Ave
- 123 S Cornell Ave
- 912 E Commonwealth Ave
Your Personal Tour Guide
Ask me questions while you tour the home.