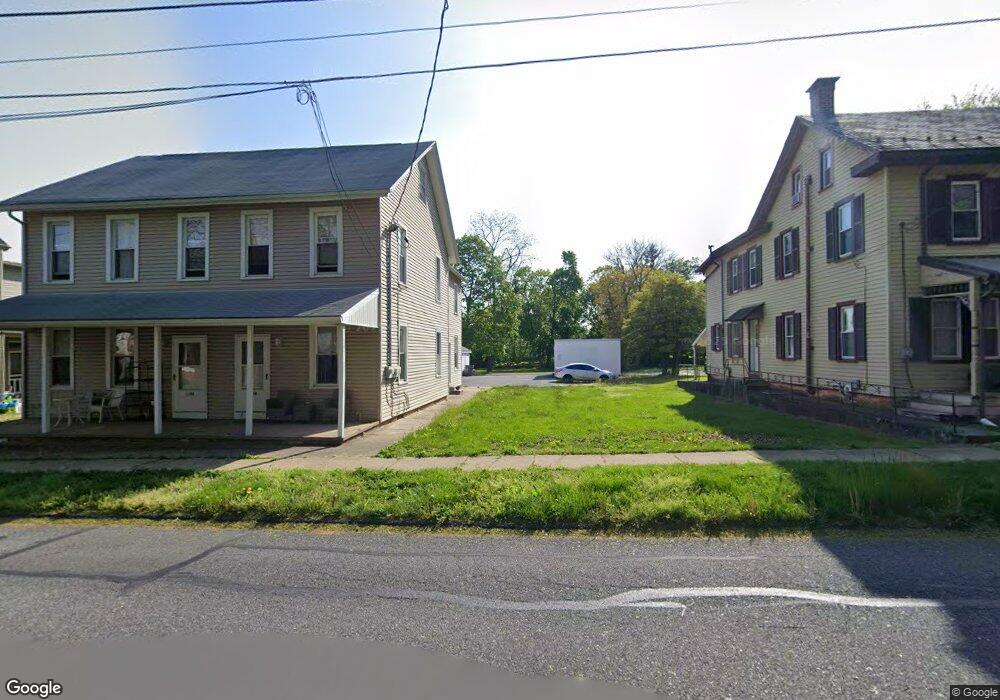
110 S Kemp St Lyon Station, PA 19536
Maxatawny NeighborhoodEstimated Value: $303,430 - $391,000
--
Bed
3
Baths
2,672
Sq Ft
$136/Sq Ft
Est. Value
About This Home
This home is located at 110 S Kemp St, Lyon Station, PA 19536 and is currently estimated at $362,858, approximately $135 per square foot. 110 S Kemp St is a home with nearby schools including Kutztown Area Senior High School, Pleasant Hills Mennonite School, and LIGHTHOUSE ISLAND ACADEMY.
Ownership History
Date
Name
Owned For
Owner Type
Purchase Details
Closed on
Mar 28, 2019
Sold by
Schran Mark K and Schran Sallyann A
Bought by
Yanan John F
Current Estimated Value
Home Financials for this Owner
Home Financials are based on the most recent Mortgage that was taken out on this home.
Original Mortgage
$163,500
Outstanding Balance
$106,137
Interest Rate
4.3%
Mortgage Type
New Conventional
Estimated Equity
$256,721
Purchase Details
Closed on
May 25, 2004
Sold by
Kohler Tamara S
Bought by
Schran Mark K and Schran Sallyann A
Home Financials for this Owner
Home Financials are based on the most recent Mortgage that was taken out on this home.
Original Mortgage
$124,000
Interest Rate
6.32%
Mortgage Type
Stand Alone First
Purchase Details
Closed on
Jun 13, 2002
Sold by
Kohler Robert L and Kohler Tamara S
Bought by
Kohler Tamara S
Home Financials for this Owner
Home Financials are based on the most recent Mortgage that was taken out on this home.
Original Mortgage
$108,000
Interest Rate
6.39%
Create a Home Valuation Report for This Property
The Home Valuation Report is an in-depth analysis detailing your home's value as well as a comparison with similar homes in the area
Home Values in the Area
Average Home Value in this Area
Purchase History
| Date | Buyer | Sale Price | Title Company |
|---|---|---|---|
| Yanan John F | $218,000 | Abe Settlement Services | |
| Schran Mark K | $155,000 | -- | |
| Kohler Tamara S | -- | Fidelity National Title Ins |
Source: Public Records
Mortgage History
| Date | Status | Borrower | Loan Amount |
|---|---|---|---|
| Open | Yanan John F | $163,500 | |
| Previous Owner | Schran Mark K | $124,000 | |
| Previous Owner | Kohler Tamara S | $108,000 |
Source: Public Records
Tax History Compared to Growth
Tax History
| Year | Tax Paid | Tax Assessment Tax Assessment Total Assessment is a certain percentage of the fair market value that is determined by local assessors to be the total taxable value of land and additions on the property. | Land | Improvement |
|---|---|---|---|---|
| 2025 | $1,003 | $92,300 | $31,100 | $61,200 |
| 2024 | $3,706 | $92,300 | $31,100 | $61,200 |
| 2023 | $3,642 | $92,300 | $31,100 | $61,200 |
| 2022 | $3,642 | $92,300 | $31,100 | $61,200 |
| 2021 | $3,642 | $92,300 | $31,100 | $61,200 |
| 2020 | $3,642 | $92,300 | $31,100 | $61,200 |
| 2019 | $3,642 | $92,300 | $31,100 | $61,200 |
| 2018 | $3,642 | $92,300 | $31,100 | $61,200 |
| 2017 | $3,616 | $92,300 | $31,100 | $61,200 |
| 2016 | $834 | $92,300 | $31,100 | $61,200 |
| 2015 | $834 | $92,300 | $31,100 | $61,200 |
| 2014 | $834 | $92,300 | $31,100 | $61,200 |
Source: Public Records
Map
Nearby Homes
- 160 Dryville Rd
- 44 Fredericksville Rd
- 136 Beaver Creek Rd
- 39 Commons Rd
- 17 Mellon School Ln
- 28 Lake Rd
- 16 Mellon School Ln
- 59 Henry Rd
- 20 High View Ln
- 12 Black Bear Run
- 28 High View Ln
- 175 Forgedale Rd
- 111 Kohler Rd
- 164 W Main St
- 113 W Main St
- 10 E Main St
- 38 S Herbein Dr
- 201 Lucille Way
- 209 Lucille Way
- 207 Lucille Way