
Seller's Agent in 2019
Geoffrey Lindsay
Capital Realty Advisors
(571) 259-4032
1 in this area
8 Total Sales
Estimated Value: $4,789,254
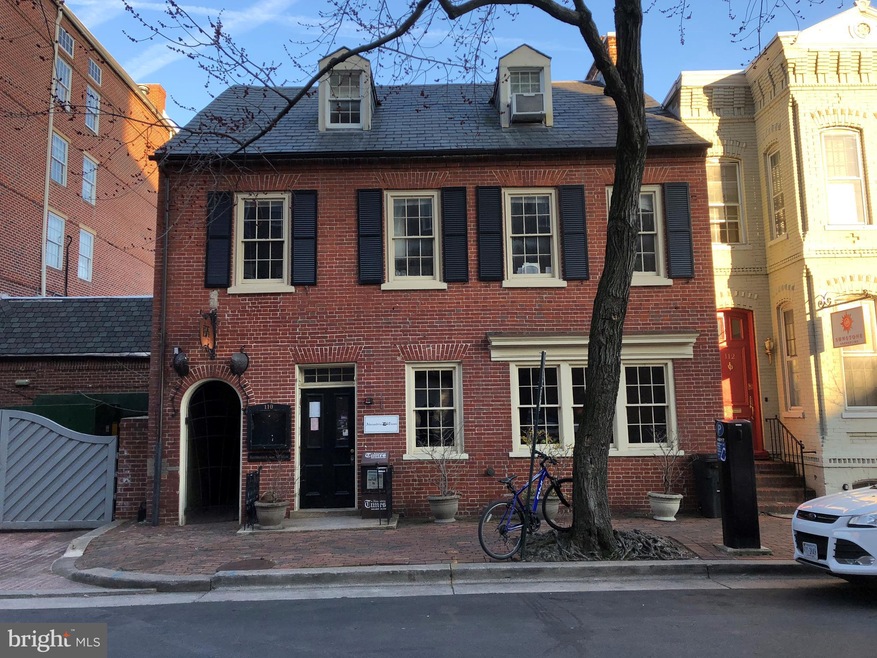
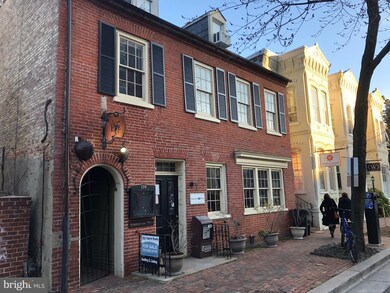
Historic Old Town charm in circa 1850s semi-detached brick colonial. Largest mixed-use property currently for sale in Old Town at over 10,000 SF. Also one of the lowest priced on a square-footage basis at $370/SF. First floor is vacant commercial space but can be converted to residential under existing zoning. 2nd floor includes a recently renovated 2-BR loft-style apt, a 3-BR apt., and a commercial office. Plus 1-BR attic apt. Upper levels fully leased, generating $100K gross income. There are 4 fireplaces in all, skylights on the main floor, and a rear patio with access easement to S. Royal St. Vacant land at rear of lot could allow additional density for either residential or commercial expansion. Buyer should perform its own due diligence with City of Alexandria Dept. of Planning and Zoning to determine. Many possibilities exist for an owner/investor, plus bonus rental income to offset mortgage. Bring your architect!
Home Type
Est. Annual Taxes
Year Built
Lot Details
Parking
Home Design
Interior Spaces
Bedrooms and Bathrooms
Additional Features
Community Details
Listing and Financial Details
| Date | Buyer | Sale Price | Title Company |
|---|---|---|---|
| Arrived Holding Llc | $4,350,000 | None Listed On Document | |
| Ws 110 Pitt Llc | $3,125,000 | Attorney | |
| 110 South Pitt L L C | $1,650,000 | -- |
| Date | Status | Borrower | Loan Amount |
|---|---|---|---|
| Open | Arrived Holding Llc | $150,000 | |
| Open | Arrived Holding Llc | $3,697,500 | |
| Previous Owner | Ws 110 Pitt Llc | $2,187,500 | |
| Previous Owner | 110 South Pitt Llc | $1,800,000 | |
| Previous Owner | 110 South Pitt L L C | $1,300,000 |
| Date | Event | Price | Change | Sq Ft Price |
|---|---|---|---|---|
| 06/19/2019 06/19/19 | Sold | $3,125,000 | -16.7% | $309 / Sq Ft |
| 04/26/2019 04/26/19 | Pending | -- | -- | -- |
| 03/06/2019 03/06/19 | For Sale | $3,750,000 | -- | $371 / Sq Ft |
| Year | Tax Paid | Tax Assessment Tax Assessment Total Assessment is a certain percentage of the fair market value that is determined by local assessors to be the total taxable value of land and additions on the property. | Land | Improvement |
|---|---|---|---|---|
| 2025 | $39,450 | $3,591,000 | $1,879,353 | $1,711,647 |
| 2024 | $39,450 | $3,420,000 | $1,789,860 | $1,630,140 |
| 2023 | $37,962 | $3,420,000 | $1,789,860 | $1,630,140 |
| 2022 | $24,864 | $2,240,000 | $1,723,643 | $516,357 |
| 2021 | $30,399 | $2,240,000 | $1,723,643 | $516,357 |
| 2020 | $34,231 | $3,034,303 | $1,723,643 | $1,310,660 |
| 2019 | $33,615 | $2,974,807 | $1,689,807 | $1,285,000 |
| 2018 | $33,615 | $2,974,807 | $1,689,807 | $1,285,000 |
| 2017 | $33,615 | $2,974,807 | $1,689,807 | $1,285,000 |
| 2016 | $30,790 | $2,869,488 | $1,686,271 | $1,183,217 |
| 2015 | $29,701 | $2,847,659 | $1,532,974 | $1,314,685 |
| 2014 | $29,701 | $2,847,659 | $1,532,974 | $1,314,685 |
Seller's Agent in 2019
Geoffrey Lindsay
Capital Realty Advisors
(571) 259-4032
1 in this area
8 Total Sales
Buyer's Agent in 2019
Jake Ermer
Hogan Companies Residential
(410) 507-4061
3 Total Sales
Source: Bright MLS
MLS Number: VAAX226900
APN: 074.02-07-25
Disclaimer: Certain information contained herein is derived from information provided by parties other than Homes.com. All information provided is deemed reliable, but is not guaranteed to be accurate and should be independently verified.
![]() The data relating to real estate for sale on this website appears in part through the BRIGHT Internet Data Exchange program, a voluntary cooperative exchange of property listing data between licensed real estate brokerage firms, and is provided by BRIGHT through a licensing agreement.
The data relating to real estate for sale on this website appears in part through the BRIGHT Internet Data Exchange program, a voluntary cooperative exchange of property listing data between licensed real estate brokerage firms, and is provided by BRIGHT through a licensing agreement.
Listing information is from various brokers who participate in the Bright MLS IDX program and not all listings may be visible on the site.
The property information being provided on or through the website is for the personal, non-commercial use of consumers and such information may not be used for any purpose other than to identify prospective properties consumers may be interested in purchasing.
Some properties which appear for sale on the website may no longer be available because they are for instance, under contract, sold or are no longer being offered for sale.
Property information displayed is deemed reliable but is not guaranteed.
Copyright 2025 Bright MLS, Inc.