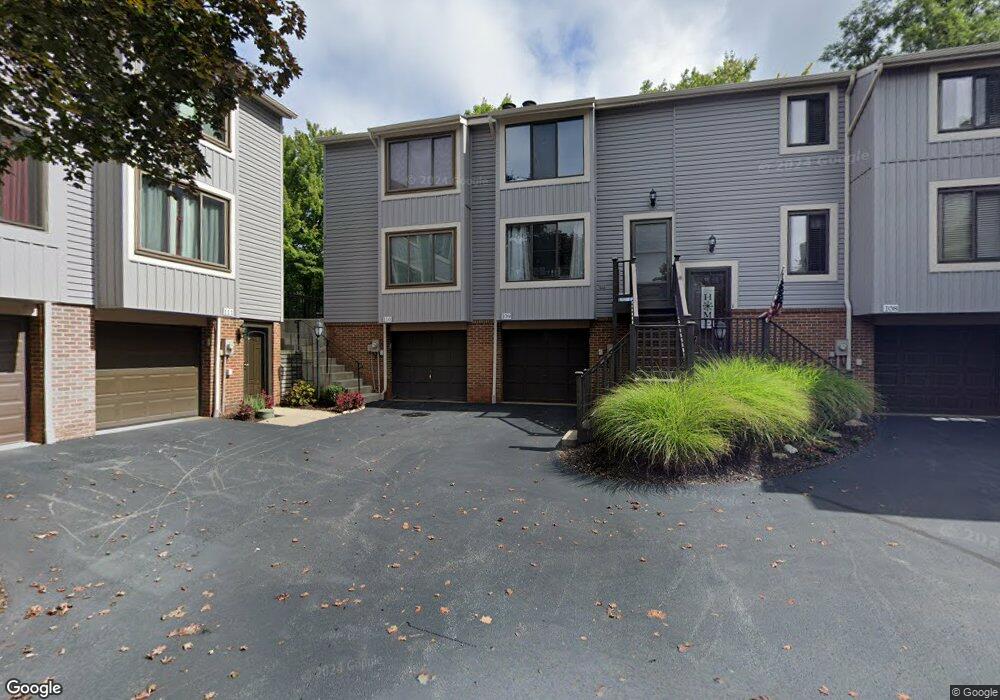
110 Serendipity Dr Unit CI10 Coraopolis, PA 15108
Estimated Value: $109,000 - $176,000
2
Beds
2
Baths
1,122
Sq Ft
$127/Sq Ft
Est. Value
About This Home
This home is located at 110 Serendipity Dr Unit CI10, Coraopolis, PA 15108 and is currently estimated at $142,322, approximately $126 per square foot. 110 Serendipity Dr Unit CI10 is a home located in Allegheny County with nearby schools including Moon Area High School, Montessori Children's Community, and St James Elementary School.
Ownership History
Date
Name
Owned For
Owner Type
Purchase Details
Closed on
Sep 17, 2024
Sold by
Kantor John R
Bought by
Z M F Mgmt L L C and Z M F Properties Iv L P
Current Estimated Value
Purchase Details
Closed on
Sep 10, 2024
Sold by
Kantor John R
Bought by
Z M F Mgmt L L C and Z M F Properties Iv L P
Purchase Details
Closed on
Sep 6, 2024
Sold by
Kantor John R
Bought by
Zmf Properties Iv Lp
Purchase Details
Closed on
May 5, 2004
Sold by
Kasko Lisa
Bought by
Kantor John
Home Financials for this Owner
Home Financials are based on the most recent Mortgage that was taken out on this home.
Original Mortgage
$66,000
Interest Rate
5.39%
Mortgage Type
New Conventional
Purchase Details
Closed on
Sep 13, 1994
Sold by
Anderson Gene and Anderson Eugene G
Bought by
Kasko Lisa M
Purchase Details
Closed on
May 2, 1994
Sold by
Fayette Bank
Bought by
Anderson Gene and Anderson Eugene G
Create a Home Valuation Report for This Property
The Home Valuation Report is an in-depth analysis detailing your home's value as well as a comparison with similar homes in the area
Home Values in the Area
Average Home Value in this Area
Purchase History
| Date | Buyer | Sale Price | Title Company |
|---|---|---|---|
| Z M F Mgmt L L C | $106,000 | -- | |
| Z M F Mgmt L L C | $106,000 | -- | |
| Z M F Mgmt L L C | $106,000 | -- | |
| Zmf Properties Iv Lp | $106,000 | -- | |
| Kantor John | $82,000 | -- | |
| Kasko Lisa M | $65,000 | -- | |
| Anderson Gene | $30,000 | -- |
Source: Public Records
Mortgage History
| Date | Status | Borrower | Loan Amount |
|---|---|---|---|
| Previous Owner | Kantor John | $66,000 |
Source: Public Records
Tax History Compared to Growth
Tax History
| Year | Tax Paid | Tax Assessment Tax Assessment Total Assessment is a certain percentage of the fair market value that is determined by local assessors to be the total taxable value of land and additions on the property. | Land | Improvement |
|---|---|---|---|---|
| 2025 | $2,204 | $88,500 | -- | $88,500 |
| 2024 | $2,204 | $70,500 | -- | $70,500 |
| 2023 | $2,125 | $70,500 | $0 | $70,500 |
| 2022 | $2,125 | $70,500 | $0 | $70,500 |
| 2021 | $2,418 | $70,500 | $0 | $70,500 |
| 2020 | $2,072 | $70,500 | $0 | $70,500 |
| 2019 | $2,015 | $70,500 | $0 | $70,500 |
| 2018 | $333 | $70,500 | $0 | $70,500 |
| 2017 | $1,905 | $70,500 | $0 | $70,500 |
| 2016 | $333 | $70,500 | $0 | $70,500 |
| 2015 | $333 | $70,500 | $0 | $70,500 |
| 2014 | $1,856 | $70,500 | $0 | $70,500 |
Source: Public Records
Map
Nearby Homes
- 201 Fernvue Dr
- 216 Duffy Dr
- 105 Rivercrest Dr
- 136 Wallridge Dr
- 1152 Queens Dr
- 156 Rivercrest Dr
- 2204 Greystone Dr
- 133 Tory Rd
- 214 Hunter Dr
- 220 Hunter Dr
- 418 Mount Vernon Ave
- 517-519 Hiland Ave
- 472 Amherst Ave
- 964 Thorn Run Rd
- 0 Thorn Run Rd
- 247 Randy Ln
- 613 Hiland Ave
- 318 Parkridge Ln
- 740 McDonald St
- 634 1/2 5th Ave
- 110 Serendipity Dr
- 109 Serendipity Dr
- 111 Serendipity Dr Unit C111
- 108 Serendipity Dr
- 112 Serendipity Dr Unit C112
- 113 Serendipity Dr Unit C113
- 107 Serendipity Dr
- 106 Serendipity Dr Unit C16
- 114 Serendipity Dr
- 105 Serendipity Dr Unit C15
- 115 Serendipity Dr
- 204 Serendipity Dr
- 104 Serendipity Dr Unit C14
- 203 Serendipity Dr Unit C203
- 201 Serendipity Dr Unit 201
- 103 Serendipity Dr
- 205 Serendipity Dr
- 202 Serendipity Dr Unit C202
- 102 Serendipity Dr
- 101 Serendipity Dr Unit C11