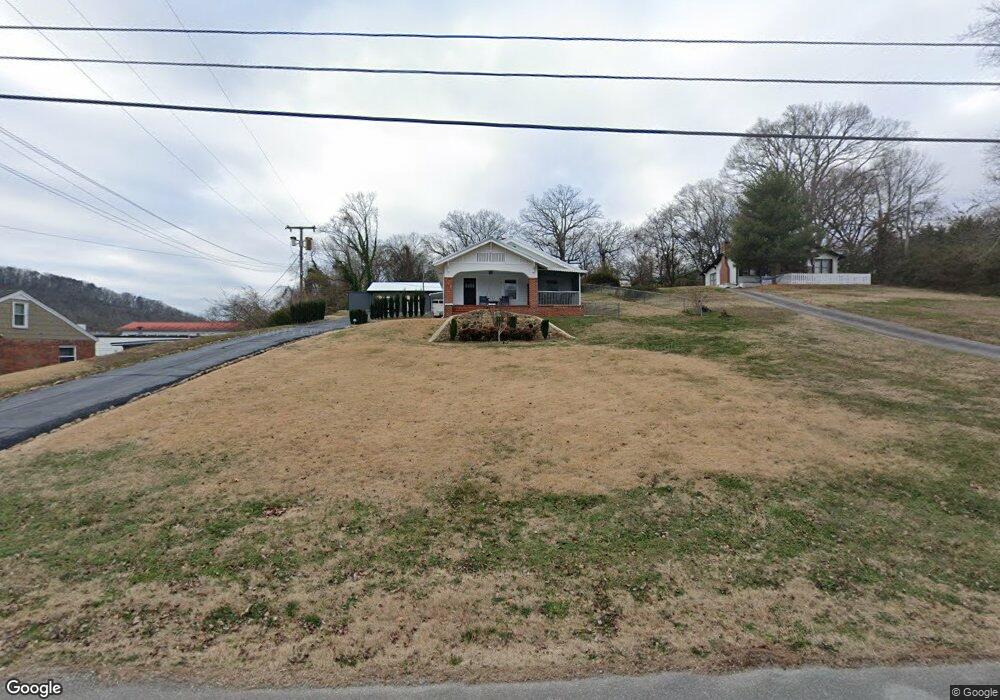
110 Signal View St Chattanooga, TN 37415
Estimated Value: $243,000 - $310,000
2
Beds
1
Bath
1,610
Sq Ft
$169/Sq Ft
Est. Value
About This Home
This home is located at 110 Signal View St, Chattanooga, TN 37415 and is currently estimated at $272,004, approximately $168 per square foot. 110 Signal View St is a home located in Hamilton County with nearby schools including Red Bank Elementary School, Red Bank Middle School, and Red Bank High School.
Ownership History
Date
Name
Owned For
Owner Type
Purchase Details
Closed on
Aug 7, 2019
Sold by
Limbaugh Paul D and Limbaugh Elizabeth E
Bought by
Vincent Kenneth A and Vincent Vicki L
Current Estimated Value
Purchase Details
Closed on
Feb 26, 2007
Sold by
Heritage Management Group Inc
Bought by
Vincent Kenneth A and Vincent Vicki L
Home Financials for this Owner
Home Financials are based on the most recent Mortgage that was taken out on this home.
Original Mortgage
$76,800
Interest Rate
6.16%
Mortgage Type
Unknown
Purchase Details
Closed on
Jan 24, 2007
Sold by
Norris Diane C
Bought by
Heritage Management Group Inc and Smith Family Land Trust
Home Financials for this Owner
Home Financials are based on the most recent Mortgage that was taken out on this home.
Original Mortgage
$76,800
Interest Rate
6.16%
Mortgage Type
Unknown
Create a Home Valuation Report for This Property
The Home Valuation Report is an in-depth analysis detailing your home's value as well as a comparison with similar homes in the area
Home Values in the Area
Average Home Value in this Area
Purchase History
| Date | Buyer | Sale Price | Title Company |
|---|---|---|---|
| Vincent Kenneth A | -- | First Title | |
| Vincent Kenneth A | $96,000 | Realty Title & Escrow | |
| Heritage Management Group Inc | $73,682 | Realty Title & Escrow Servic |
Source: Public Records
Mortgage History
| Date | Status | Borrower | Loan Amount |
|---|---|---|---|
| Previous Owner | Vincent Kenneth A | $76,800 |
Source: Public Records
Tax History Compared to Growth
Tax History
| Year | Tax Paid | Tax Assessment Tax Assessment Total Assessment is a certain percentage of the fair market value that is determined by local assessors to be the total taxable value of land and additions on the property. | Land | Improvement |
|---|---|---|---|---|
| 2024 | $912 | $40,775 | $0 | $0 |
| 2023 | $1,663 | $40,775 | $0 | $0 |
| 2022 | $1,401 | $40,775 | $0 | $0 |
| 2021 | $1,593 | $40,775 | $0 | $0 |
| 2020 | $1,560 | $32,050 | $0 | $0 |
| 2019 | $1,560 | $32,050 | $0 | $0 |
| 2018 | $1,541 | $31,600 | $0 | $0 |
| 2017 | $1,476 | $31,600 | $0 | $0 |
| 2016 | $1,245 | $0 | $0 | $0 |
| 2015 | $1,245 | $24,725 | $0 | $0 |
| 2014 | $1,245 | $0 | $0 | $0 |
Source: Public Records
Map
Nearby Homes
- 2510 Nonova Ln
- 2400 Ashmore Ave
- 127 P Poole Ave
- 2400 Briggs Ave
- 120 Sweetland Dr
- 2621 Berkley Dr
- 2535 Leaning Tree Ln
- 103 Laurel Dr
- 234 Hendricks Blvd
- 918 Lullwater Rd
- 295 Vreeland St
- 116 Harding Rd
- 911 Lullwater Rd
- 151 W Ridgewood Ave
- 523 Hedgewood Dr
- 2583 Highpoint Dr
- 2589 High Point Dr
- 2015 James Ave
- 3115 Greenwich Ave
- 2922 Nurick Dr
- 102 Signal View St
- 107 Signal View St
- 204 Signal View St
- 111 Signal View St
- 109 Signal View St
- 109 Signal View St Unit C&D
- 109 Signal View St Unit A&B
- 109 Signal View St Unit a
- 109 Signal View St Unit 1
- 109 Signal View St Unit 4
- 2422 Charlotte Ave
- 2415 Dayton Blvd
- 113 Signal View St
- 113 Signal View St Unit 3
- 113 Signal View St Unit 1
- 2420 Charlotte Ave
- 206 Signal View St
- 205 Signal View St
- 2508 Fyffe Ave
- 208 Signal View St