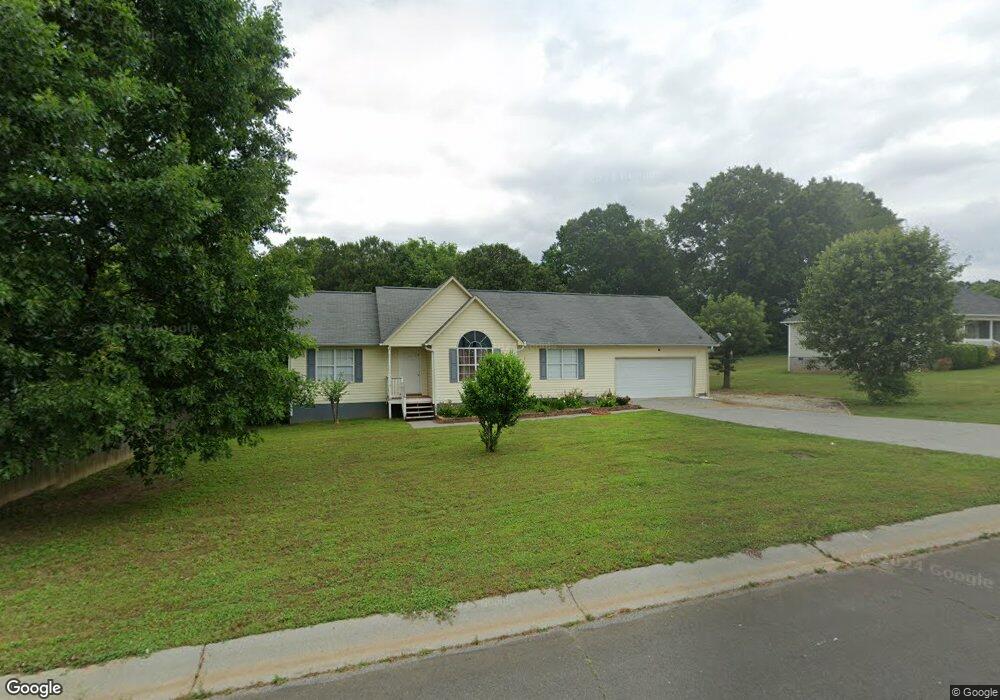
110 Sonora Dr SE Calhoun, GA 30701
Estimated Value: $249,000 - $295,000
3
Beds
2
Baths
1,536
Sq Ft
$179/Sq Ft
Est. Value
About This Home
This home is located at 110 Sonora Dr SE, Calhoun, GA 30701 and is currently estimated at $275,292, approximately $179 per square foot. 110 Sonora Dr SE is a home located in Gordon County with nearby schools including Sonoraville Elementary School, Red Bud Middle School, and Sonoraville High School.
Ownership History
Date
Name
Owned For
Owner Type
Purchase Details
Closed on
May 16, 2007
Sold by
Sec Of Housing & U
Bought by
Tirador Dagoberto
Current Estimated Value
Home Financials for this Owner
Home Financials are based on the most recent Mortgage that was taken out on this home.
Original Mortgage
$97,950
Outstanding Balance
$58,537
Interest Rate
6.12%
Mortgage Type
New Conventional
Estimated Equity
$216,755
Purchase Details
Closed on
Nov 7, 2006
Sold by
Midfirst Bank
Bought by
Sec Of Housing & Urban
Purchase Details
Closed on
Apr 21, 2005
Sold by
Santos Homero
Bought by
Nwg Real Estate Svcs Llc
Purchase Details
Closed on
Jun 30, 2000
Sold by
Boswell David E
Bought by
Santos Homero and Santos Maria D
Purchase Details
Closed on
Jul 16, 1999
Bought by
Boswell David E
Create a Home Valuation Report for This Property
The Home Valuation Report is an in-depth analysis detailing your home's value as well as a comparison with similar homes in the area
Home Values in the Area
Average Home Value in this Area
Purchase History
| Date | Buyer | Sale Price | Title Company |
|---|---|---|---|
| Tirador Dagoberto | -- | -- | |
| Sec Of Housing & Urban | $112,933 | -- | |
| Midfirst Bank | $112,933 | -- | |
| Nwg Real Estate Svcs Llc | -- | -- | |
| Santos Homero | $91,300 | -- | |
| Boswell David E | -- | -- |
Source: Public Records
Mortgage History
| Date | Status | Borrower | Loan Amount |
|---|---|---|---|
| Open | Tirador Dagoberto | $97,950 | |
| Closed | Tirador Dagoberto | $3,050 |
Source: Public Records
Tax History
| Year | Tax Paid | Tax Assessment Tax Assessment Total Assessment is a certain percentage of the fair market value that is determined by local assessors to be the total taxable value of land and additions on the property. | Land | Improvement |
|---|---|---|---|---|
| 2025 | $2,214 | $89,680 | $5,520 | $84,160 |
| 2024 | $2,001 | $78,760 | $5,520 | $73,240 |
| 2023 | $1,870 | $73,600 | $5,520 | $68,080 |
| 2022 | $1,849 | $68,440 | $5,520 | $62,920 |
| 2021 | $1,533 | $54,720 | $4,120 | $50,600 |
| 2020 | $1,591 | $55,520 | $4,120 | $51,400 |
| 2019 | $1,599 | $55,520 | $4,120 | $51,400 |
| 2018 | $1,234 | $42,840 | $3,560 | $39,280 |
| 2017 | $1,202 | $40,560 | $3,560 | $37,000 |
| 2016 | $1,205 | $40,560 | $3,560 | $37,000 |
| 2015 | $1,192 | $39,760 | $3,560 | $36,200 |
| 2014 | $828 | $28,439 | $2,688 | $25,751 |
Source: Public Records
Map
Nearby Homes
- 127 Ash Ct SE
- 00 Fairmount Hwy SE
- 1005 Erwin Hill Church Rd SE
- 6741 Fairmount Hwy SE
- 668 Pendley Rd SE
- 157 Asbury Cir
- 135 Grist Mill Ln SE
- 544 Beason Rd SE
- 358 Talon Dr SE
- 264 Boone Ford Rd SE
- 2453 Boone Ford Rd SE
- 165 Richland St SE
- 249 Cooper Rd SE
- 312 Triple D Dr SE
- 887 Big Springs Rd SE
- 171 Oakland Dr SE
- 2113 Union Grove Church Rd SE
- 121 Shire Loop
- 109 Shire Loop
- 0 Fairmount Hwy SE Unit 9614-P 10489713
- 120 Sonora Dr SE
- 244 Erwin Hill Rd SE
- 254 Erwin Hill Rd SE
- 130 Sonora Dr SE
- 111 Sonora Dr SE
- 121 Sonora Dr SE
- 121 Fieldcrest Dr SE
- 140 Sonora Dr SE
- 131 Fieldcrest Dr SE
- 111 Fieldcrest Dr SE
- 131 Sonora Dr SE
- 141 Fieldcrest Dr SE
- 101 Fieldcrest Dr SE
- 280 Erwin Hill Church Rd SE
- 151 Fieldcrest Dr SE
- 150 Sonora Dr SE
- 141 Sonora Dr SE
- 161 Fieldcrest Dr SE
- 300 Erwin Hill Rd SE
- 290 Erwin Hill Rd SE
Your Personal Tour Guide
Ask me questions while you tour the home.