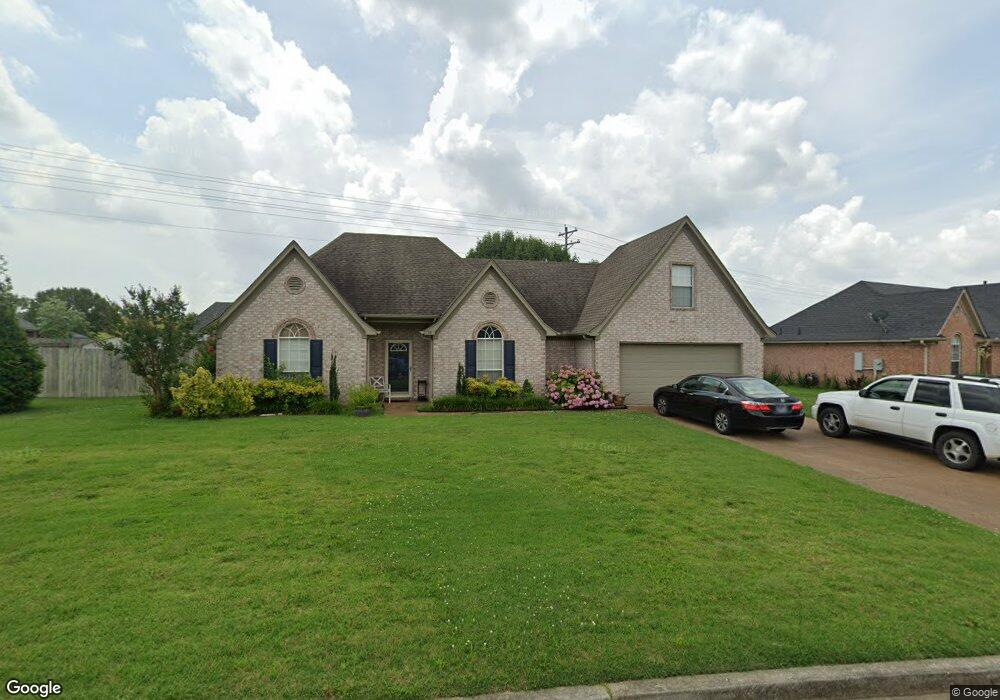
110 Spring Valley Dr Unit 2293031-59551 Oakland, TN 38060
Estimated Value: $270,000 - $289,208
--
Bed
3
Baths
1,632
Sq Ft
$171/Sq Ft
Est. Value
About This Home
This home is located at 110 Spring Valley Dr Unit 2293031-59551, Oakland, TN 38060 and is currently estimated at $279,802, approximately $171 per square foot. 110 Spring Valley Dr Unit 2293031-59551 is a home located in Fayette County with nearby schools including Oakland Elementary School, West Junior High School, and Fayette Ware Comprehensive High School.
Ownership History
Date
Name
Owned For
Owner Type
Purchase Details
Closed on
Jul 31, 2013
Sold by
Knopf Johhny S
Bought by
Grubbs Casey Duane and Grubbs Candice Kristin
Current Estimated Value
Home Financials for this Owner
Home Financials are based on the most recent Mortgage that was taken out on this home.
Original Mortgage
$140,816
Outstanding Balance
$104,300
Interest Rate
4.29%
Mortgage Type
Commercial
Estimated Equity
$175,502
Purchase Details
Closed on
Nov 5, 2012
Sold by
Knopf Johhny S
Bought by
Knopf Johhny S and Knopf Susan
Purchase Details
Closed on
Jun 15, 2004
Sold by
Skip Hobbs Construction Ll
Bought by
Knopf Johnny S
Home Financials for this Owner
Home Financials are based on the most recent Mortgage that was taken out on this home.
Original Mortgage
$135,219
Interest Rate
6.09%
Mortgage Type
VA
Create a Home Valuation Report for This Property
The Home Valuation Report is an in-depth analysis detailing your home's value as well as a comparison with similar homes in the area
Home Values in the Area
Average Home Value in this Area
Purchase History
| Date | Buyer | Sale Price | Title Company |
|---|---|---|---|
| Grubbs Casey Duane | $138,000 | -- | |
| Grubbs Casey Duane | -- | -- | |
| Knopf Johhny S | -- | -- | |
| Knopf Johnny S | $130,900 | -- |
Source: Public Records
Mortgage History
| Date | Status | Borrower | Loan Amount |
|---|---|---|---|
| Open | Grubbs Casey Duane | $140,816 | |
| Previous Owner | Knopf Johnny S | $135,219 |
Source: Public Records
Tax History Compared to Growth
Tax History
| Year | Tax Paid | Tax Assessment Tax Assessment Total Assessment is a certain percentage of the fair market value that is determined by local assessors to be the total taxable value of land and additions on the property. | Land | Improvement |
|---|---|---|---|---|
| 2024 | $638 | $50,225 | $9,500 | $40,725 |
| 2023 | $1,298 | $50,225 | $0 | $0 |
| 2022 | $861 | $50,225 | $9,500 | $40,725 |
| 2021 | $861 | $50,225 | $9,500 | $40,725 |
| 2020 | $573 | $50,225 | $9,500 | $40,725 |
| 2019 | $771 | $38,000 | $7,500 | $30,500 |
| 2018 | $793 | $38,000 | $7,500 | $30,500 |
| 2017 | $676 | $38,000 | $7,500 | $30,500 |
| 2016 | $673 | $35,375 | $7,500 | $27,875 |
| 2015 | $673 | $35,375 | $7,500 | $27,875 |
| 2014 | $673 | $35,375 | $7,500 | $27,875 |
Source: Public Records
Map
Nearby Homes
- 30 Mossy Springs Cove
- 245 Mossy Springs Dr
- 165 Susanne Dr
- 245 Susanne Dr
- 45 Sadie Cove
- 70 Valleyview Ln
- 270 Oak St
- 170 Oakland Ridge Cove
- 40 Windy Cove
- 0 Mcfadden Dr Unit 10209515
- 280 Beau Tisdale Dr
- 000 Hwy 64
- 10 Blackthorn Cove
- 24.17 AC Tennessee 194
- 25 Breezy Loop
- 65 Grace Ann Ln
- 360 Saint Andrews Dr
- 300 Saint Andrews Dr
- 290 Saint Andrews Dr
- 0 Mcauley St Unit 10186597
- 110 Spring Valley Dr
- 90 Spring Valley Dr
- 115 Spring Valley Dr
- 105 Spring Valley Dr
- 70 Mossy Springs Dr
- 80 Spring Valley Dr
- 95 Spring Valley Dr
- 125 Spring Valley Dr
- 30 Abbey Rd
- 50 Abbey Rd
- 40 Abbey Rd
- 85 Spring Valley Dr
- 10 Abbey Rd
- 55 Mossy Springs Dr
- 70 Spring Valley Dr
- 65 Garden View Dr
- 75 Mossy Springs Dr
- 35 Mossy Springs Dr
- 75 Garden View Dr
- 55 Garden View Dr