M
Seller's Agent in 2026
Mary Gasparini
Drake Realty, Inc.
(770) 365-4865
1 in this area
137 Total Sales
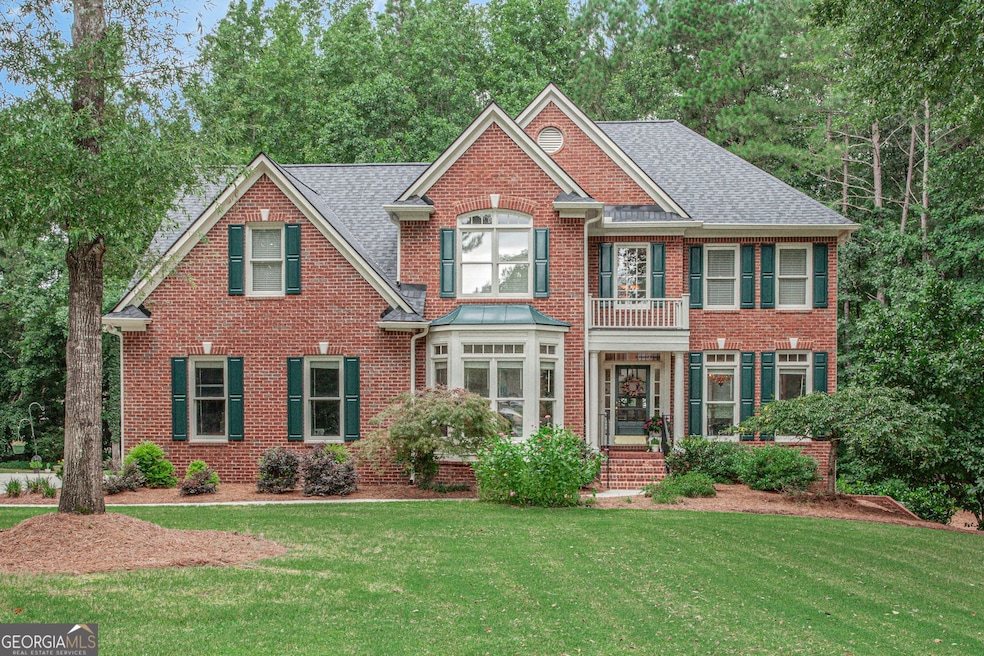
BACK ON THE MARKET!! PREVIOUS CONTRACT ENDED AT NO FAULT TO THE SELLERS! Welcome to this beautiful 3-sided brick home, perfectly situated on a private 1-acre cul-de-sac lot with a sparkling saltwater pool and spacious backyard oasis. This well-maintained home features a brand-new roof and is designed for both everyday living and entertaining. Step inside the 2 story foyer to find an open-concept kitchen with crisp white cabinetry, granite countertops, Kitchen Aide appliances, and a view to the inviting family room. A combo living/dining room offers flexibility, while the main-level bedroom is ideal for guests or a private home office. Gorgeous hardwood floors run thru the hall, kitchen and family room, and a deck off the kitchen overlooks the pool and backyard. Upstairs, you'll find two secondary bedrooms with a Jack-and-Jill bath, a secondary bedroom with a full bath, a convenient laundry room, and a spacious primary suite. The primary bedroom boasts an oversized dressing-room style closet, plus an en-suite with a tile shower, jetted tub, double vanities, and an additional walk-in closet. The finished terrace level offers even more living space with a large recreation room, an additional bedroom with a full bath, and walkout access to the pool. Unfinished areas provide excellent storage and a workshop space. Enjoy summers relaxing by the pool, grilling on the deck, or playing in the large, private backyard-a perfect blend of comfort and outdoor fun. Don't miss the opportunity to own this move-in ready home with space for everyone inside and out
Last Agent to Sell the Property
Drake Realty, Inc. License #297715 Listed on: 11/12/2025
| Date | Type | Sale Price | Title Company |
|---|---|---|---|
| Deed | -- | -- | |
| Deed | $390,000 | -- | |
| Deed | $324,000 | -- |
| Date | Status | Loan Amount | Loan Type |
|---|---|---|---|
| Previous Owner | $225,000 | New Conventional | |
| Previous Owner | $195,000 | New Conventional |
| Date | Event | Price | List to Sale | Price per Sq Ft |
|---|---|---|---|---|
| 02/02/2026 02/02/26 | Sold | $650,000 | +0.2% | $156 / Sq Ft |
| 01/17/2026 01/17/26 | Pending | -- | -- | -- |
| 11/12/2025 11/12/25 | For Sale | $649,000 | -- | $156 / Sq Ft |
| Year | Tax Paid | Tax Assessment Tax Assessment Total Assessment is a certain percentage of the fair market value that is determined by local assessors to be the total taxable value of land and additions on the property. | Land | Improvement |
|---|---|---|---|---|
| 2025 | $5,750 | $252,717 | $38,520 | $214,197 |
| 2024 | $5,598 | $236,184 | $36,000 | $200,184 |
| 2023 | $5,205 | $230,760 | $36,000 | $194,760 |
| 2022 | $5,022 | $182,240 | $36,000 | $146,240 |
| 2021 | $4,772 | $162,840 | $36,000 | $126,840 |
| 2020 | $4,706 | $153,200 | $21,600 | $131,600 |
| 2019 | $4,716 | $152,040 | $21,600 | $130,440 |
| 2018 | $4,505 | $143,880 | $21,600 | $122,280 |
| 2017 | $4,715 | $149,920 | $21,600 | $128,320 |
| 2016 | $4,133 | $129,160 | $21,600 | $107,560 |
| 2015 | $4,094 | $125,880 | $21,600 | $104,280 |
| 2014 | $3,598 | $109,080 | $21,600 | $87,480 |
| 2013 | -- | $104,760 | $0 | $0 |
M
Seller's Agent in 2026
Mary Gasparini
Drake Realty, Inc.
(770) 365-4865
1 in this area
137 Total Sales

Buyer's Agent in 2026
Tina Bantin
Dwelli
(770) 762-2145
1 in this area
42 Total Sales
Source: Georgia MLS
MLS Number: 10642603
APN: 07-28-15-004
Disclaimer: Certain information contained herein is derived from information provided by parties other than Homes.com. All information provided is deemed reliable, but is not guaranteed to be accurate and should be independently verified.
![]() The data relating to real estate for sale on this web site comes in part from the Broker Reciprocity Program of Georgia MLS. Real estate listings held by brokerage firms other than Redfin are marked with the Broker Reciprocity logo and detailed information about them includes the name of the listing brokers. Information deemed reliable but not guaranteed. Copyright 2026 Georgia MLS. All rights reserved.
The data relating to real estate for sale on this web site comes in part from the Broker Reciprocity Program of Georgia MLS. Real estate listings held by brokerage firms other than Redfin are marked with the Broker Reciprocity logo and detailed information about them includes the name of the listing brokers. Information deemed reliable but not guaranteed. Copyright 2026 Georgia MLS. All rights reserved.
Ask me questions while you tour the home.