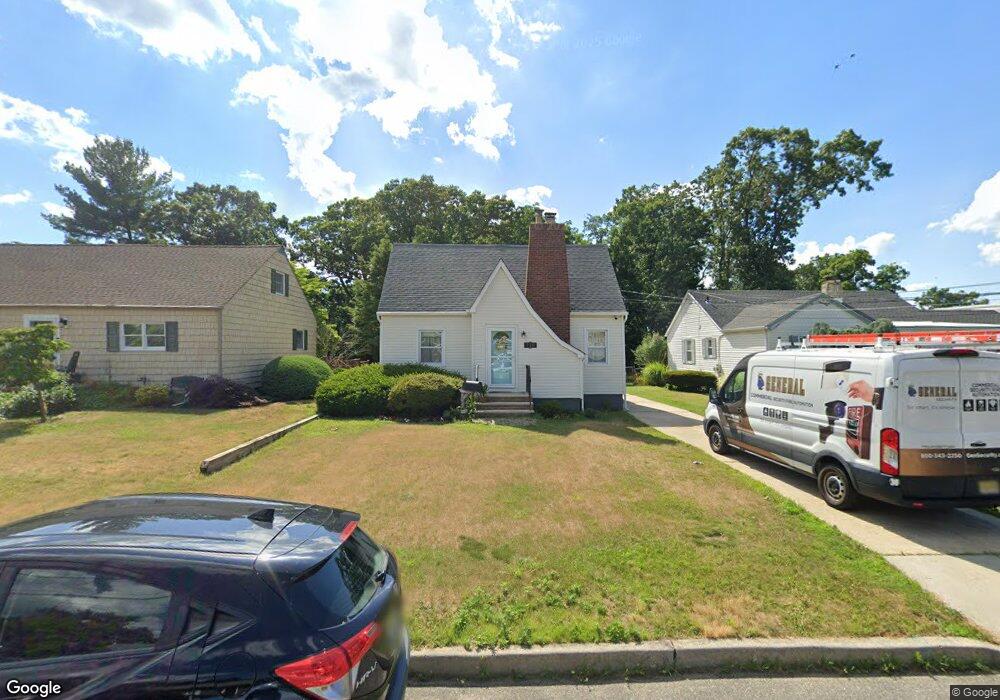
110 Therese Ave Keyport, NJ 07735
Estimated Value: $481,000 - $543,738
3
Beds
2
Baths
1,748
Sq Ft
$296/Sq Ft
Est. Value
About This Home
This home is located at 110 Therese Ave, Keyport, NJ 07735 and is currently estimated at $517,685, approximately $296 per square foot. 110 Therese Ave is a home located in Monmouth County with nearby schools including Keyport Central School, Keyport High School, and Icob Academy.
Ownership History
Date
Name
Owned For
Owner Type
Purchase Details
Closed on
Nov 29, 2021
Sold by
Hicks Thomas A and Hicks Eileen
Bought by
Lambe Todd and Massas Charissa
Current Estimated Value
Home Financials for this Owner
Home Financials are based on the most recent Mortgage that was taken out on this home.
Original Mortgage
$318,223
Outstanding Balance
$292,799
Interest Rate
3.14%
Mortgage Type
FHA
Estimated Equity
$224,886
Create a Home Valuation Report for This Property
The Home Valuation Report is an in-depth analysis detailing your home's value as well as a comparison with similar homes in the area
Home Values in the Area
Average Home Value in this Area
Purchase History
| Date | Buyer | Sale Price | Title Company |
|---|---|---|---|
| Lambe Todd | $347,500 | Acres Land Title Agency Inc |
Source: Public Records
Mortgage History
| Date | Status | Borrower | Loan Amount |
|---|---|---|---|
| Open | Lambe Todd | $318,223 |
Source: Public Records
Tax History Compared to Growth
Tax History
| Year | Tax Paid | Tax Assessment Tax Assessment Total Assessment is a certain percentage of the fair market value that is determined by local assessors to be the total taxable value of land and additions on the property. | Land | Improvement |
|---|---|---|---|---|
| 2025 | $8,735 | $462,100 | $213,100 | $249,000 |
| 2024 | $8,616 | $422,000 | $185,300 | $236,700 |
| 2023 | $8,616 | $392,000 | $168,500 | $223,500 |
| 2022 | $7,113 | $340,800 | $146,500 | $194,300 |
| 2021 | $7,113 | $281,800 | $135,700 | $146,100 |
| 2020 | $6,851 | $269,400 | $130,400 | $139,000 |
| 2019 | $6,632 | $261,200 | $125,400 | $135,800 |
| 2018 | $6,695 | $257,500 | $130,400 | $127,100 |
| 2017 | $6,541 | $250,900 | $125,400 | $125,500 |
| 2016 | $6,320 | $244,500 | $125,400 | $119,100 |
| 2015 | $5,919 | $227,900 | $110,400 | $117,500 |
| 2014 | $5,931 | $230,600 | $85,400 | $145,200 |
Source: Public Records
Map
Nearby Homes
- 1 Hobart St
- 52 Highway 35
- 54 Chingarora Ave
- 95 Broadway
- 253 Broadway
- 8 Chingarora Ave
- 127 Chingarora Ave
- 324 Maple Place
- 369 Riverdale Dr
- 22 Lower Main St
- 9 Monmouth Place
- 557 Lloyd Rd Unit B
- 90 Saint Peters Place
- 358 Shadynook St
- 345 Shadynook St
- 215 Edgeview Rd
- 227 W Prospect Ave
- 23 Mathiasen Place
- 226 Osborn St
- 154 Lower Main St
- 104 Therese Ave
- 120 Therese Ave
- 60 Chandler Ave
- 50 Chandler Ave
- 128 Therese Ave
- 62 Chandler Ave
- 103 Therese Ave
- 111 Therese Ave
- 101 Therese Ave
- 119 Therese Ave
- 97 Therese Ave
- 134 Therese Ave
- 48 Chandler Ave
- 125 Therese Ave
- 64 Chandler Ave
- 90 Therese Ave
- 47 Provost Ave
- 57 Chandler Ave
- 55 Chandler Ave
- 152 Washington St