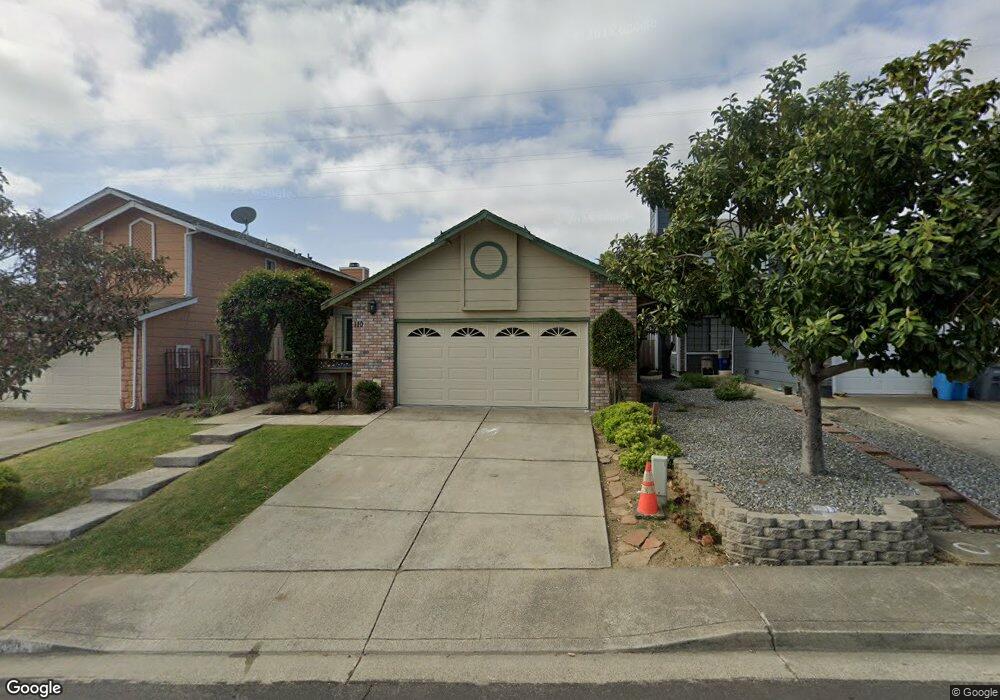
110 Trident Ct Vallejo, CA 94591
Glen Cove NeighborhoodEstimated Value: $550,857 - $644,000
3
Beds
2
Baths
1,564
Sq Ft
$381/Sq Ft
Est. Value
About This Home
This home is located at 110 Trident Ct, Vallejo, CA 94591 and is currently estimated at $596,214, approximately $381 per square foot. 110 Trident Ct is a home located in Solano County with nearby schools including Glen Cove Elementary, Jesse M. Bethel High School, and Vallejo Charter School.
Ownership History
Date
Name
Owned For
Owner Type
Purchase Details
Closed on
Jun 8, 2021
Sold by
Cabebe Alejandro and Cabebe Anna Marie
Bought by
Cabebe Alejandro and Cabebe Anna Marie
Current Estimated Value
Purchase Details
Closed on
Aug 2, 2001
Sold by
Cabebe Alejandro C and Cabebe Anna Marie G
Bought by
Cabebe Alejandro C and Cabebe Anna Marie G
Home Financials for this Owner
Home Financials are based on the most recent Mortgage that was taken out on this home.
Original Mortgage
$191,240
Outstanding Balance
$74,330
Interest Rate
7.1%
Estimated Equity
$521,884
Purchase Details
Closed on
Oct 11, 1995
Sold by
Williams Randall R and Williams Sheila E
Bought by
Cabebe Alejandro C and Cabebe Anna Marie G
Home Financials for this Owner
Home Financials are based on the most recent Mortgage that was taken out on this home.
Original Mortgage
$147,250
Interest Rate
7.67%
Create a Home Valuation Report for This Property
The Home Valuation Report is an in-depth analysis detailing your home's value as well as a comparison with similar homes in the area
Home Values in the Area
Average Home Value in this Area
Purchase History
| Date | Buyer | Sale Price | Title Company |
|---|---|---|---|
| Cabebe Alejandro | -- | None Available | |
| Cabebe Alejandro C | -- | Fidelity National Title Co | |
| Cabebe Alejandro C | $155,000 | North American Title Company |
Source: Public Records
Mortgage History
| Date | Status | Borrower | Loan Amount |
|---|---|---|---|
| Open | Cabebe Alejandro C | $191,240 | |
| Closed | Cabebe Alejandro C | $147,250 |
Source: Public Records
Tax History
| Year | Tax Paid | Tax Assessment Tax Assessment Total Assessment is a certain percentage of the fair market value that is determined by local assessors to be the total taxable value of land and additions on the property. | Land | Improvement |
|---|---|---|---|---|
| 2025 | $4,639 | $290,052 | $91,366 | $198,686 |
| 2024 | $4,639 | $284,366 | $89,575 | $194,791 |
| 2023 | $4,380 | $278,791 | $87,819 | $190,972 |
| 2022 | $4,477 | $273,326 | $86,098 | $187,228 |
| 2021 | $4,186 | $267,967 | $84,410 | $183,557 |
| 2020 | $4,200 | $265,220 | $83,545 | $181,675 |
| 2019 | $4,077 | $260,020 | $81,907 | $178,113 |
| 2018 | $3,828 | $254,922 | $80,301 | $174,621 |
| 2017 | $3,665 | $249,925 | $78,727 | $171,198 |
| 2016 | $3,093 | $245,026 | $77,184 | $167,842 |
| 2015 | $3,052 | $241,346 | $76,025 | $165,321 |
| 2014 | $2,914 | $236,619 | $74,536 | $162,083 |
Source: Public Records
Map
Nearby Homes
- 133 Windsurfer Ct
- 137 Pirates Cove
- 181 Crowsnest Ct
- 1000 Topsail Dr
- 180 Winter Harbor Place
- 7 Cliff Walk Dr
- 293 Saybrook Way
- 900 Cambridge Dr Unit 122
- 900 Cambridge Dr Unit 56
- 900 Cambridge Dr Unit 114
- 900 Cambridge Dr Unit 104
- 401 Stinson St Unit 4
- 256 Honeydew Dr
- 100 Bear Cove Ct
- 157 James River Rd
- 1365 W L St
- 423 Loring Ave
- 1201 Glen Cove Pkwy Unit 1616
- 1201 Glen Cove Pkwy Unit 1505
- 1740 Stuart Ct
- 120 Trident Ct
- 100 Trident Ct
- 130 Trident Ct
- 140 Trident Ct
- 111 Trident Ct
- 150 Trident Ct
- 173 Neptunes Ct
- 160 Trident Ct
- 155 Neptunes Ct
- 220 Neptunes Ct
- 240 Neptunes Ct
- 254 Neptunes Ct
- 131 Trident Ct
- 109 Windsurfer Ct
- 137 Neptunes Ct
- 1315 Spyglass Pkwy
- 1305 Spyglass Pkwy
- 171 Trident Ct
- 280 Neptunes Ct
Your Personal Tour Guide
Ask me questions while you tour the home.