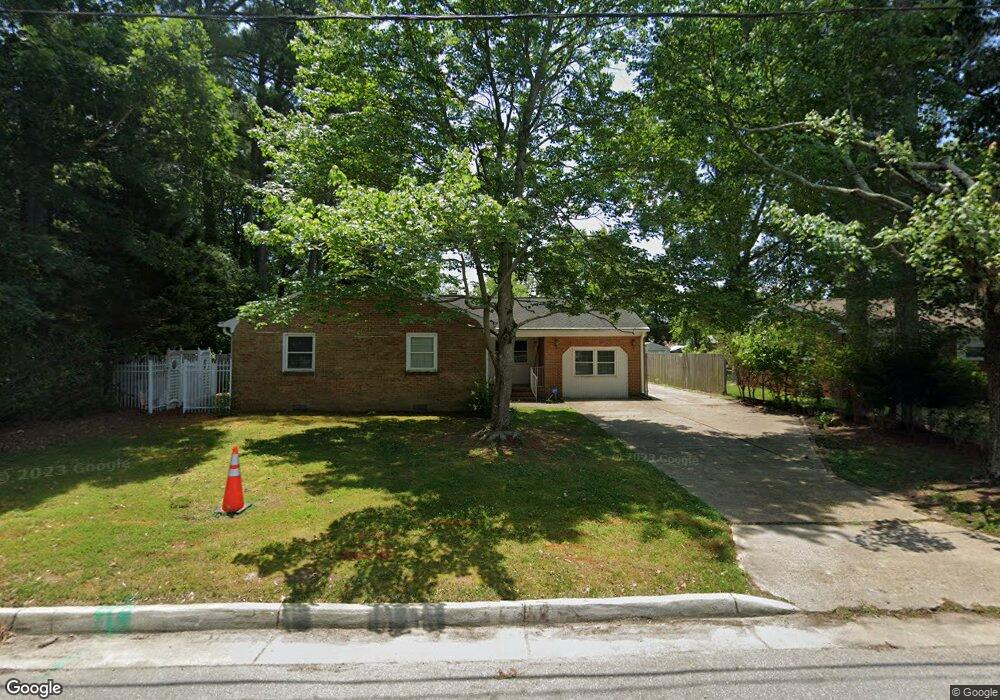
110 Tyner Dr Newport News, VA 23608
Richneck NeighborhoodEstimated Value: $255,000 - $332,000
3
Beds
2
Baths
1,701
Sq Ft
$177/Sq Ft
Est. Value
About This Home
This home is located at 110 Tyner Dr, Newport News, VA 23608 and is currently estimated at $301,245, approximately $177 per square foot. 110 Tyner Dr is a home located in Newport News City with nearby schools including Richneck Elementary School, Ella Fitzgerald Middle School, and Woodside High School.
Ownership History
Date
Name
Owned For
Owner Type
Purchase Details
Closed on
Oct 29, 2018
Sold by
Wilson Jerrelle A
Bought by
Peterson Shantenez M
Current Estimated Value
Home Financials for this Owner
Home Financials are based on the most recent Mortgage that was taken out on this home.
Original Mortgage
$122,100
Outstanding Balance
$108,444
Interest Rate
5.5%
Mortgage Type
FHA
Estimated Equity
$192,801
Purchase Details
Closed on
Feb 25, 2009
Sold by
Shiver Ellen
Bought by
Wilson Jerrelle A
Home Financials for this Owner
Home Financials are based on the most recent Mortgage that was taken out on this home.
Original Mortgage
$226,773
Interest Rate
5%
Mortgage Type
VA
Purchase Details
Closed on
Aug 27, 1999
Sold by
Canavan Lisa Ann
Bought by
Shiver Edward M
Home Financials for this Owner
Home Financials are based on the most recent Mortgage that was taken out on this home.
Original Mortgage
$81,697
Interest Rate
7.53%
Create a Home Valuation Report for This Property
The Home Valuation Report is an in-depth analysis detailing your home's value as well as a comparison with similar homes in the area
Home Values in the Area
Average Home Value in this Area
Purchase History
| Date | Buyer | Sale Price | Title Company |
|---|---|---|---|
| Peterson Shantenez M | $130,000 | Title Concepts | |
| Wilson Jerrelle A | $222,000 | -- | |
| Shiver Edward M | $94,900 | -- |
Source: Public Records
Mortgage History
| Date | Status | Borrower | Loan Amount |
|---|---|---|---|
| Open | Peterson Shantenez M | $122,100 | |
| Previous Owner | Wilson Jerrelle A | $226,773 | |
| Previous Owner | Shiver Edward M | $81,697 |
Source: Public Records
Tax History Compared to Growth
Tax History
| Year | Tax Paid | Tax Assessment Tax Assessment Total Assessment is a certain percentage of the fair market value that is determined by local assessors to be the total taxable value of land and additions on the property. | Land | Improvement |
|---|---|---|---|---|
| 2025 | $3,624 | $307,800 | $69,600 | $238,200 |
| 2024 | $3,499 | $296,500 | $69,600 | $226,900 |
| 2023 | $3,403 | $275,900 | $69,600 | $206,300 |
| 2022 | $3,241 | $257,800 | $69,600 | $188,200 |
| 2021 | $2,736 | $224,300 | $58,000 | $166,300 |
| 2020 | $2,630 | $203,500 | $58,000 | $145,500 |
| 2019 | $2,393 | $184,500 | $58,000 | $126,500 |
| 2018 | $2,317 | $178,500 | $58,000 | $120,500 |
| 2017 | $2,317 | $178,500 | $58,000 | $120,500 |
| 2016 | $2,313 | $178,500 | $58,000 | $120,500 |
| 2015 | $2,307 | $178,500 | $58,000 | $120,500 |
| 2014 | $2,069 | $181,500 | $58,000 | $123,500 |
Source: Public Records
Map
Nearby Homes
- 12 Chowan Place
- 408 Chowan Place
- 202 Tower Ln
- 962 Red Oak Cir
- 712 Princess Ct
- 708 Princess Ct
- 182 Ridgewood Pkwy
- 844 Melrose Terrace
- 802 Purdey Ct
- 421 Richneck Rd
- 9 Friedman Place
- 714 Galahad Dr
- 808 Melrose Terrace
- 471 Richneck Rd
- 425 Truxtun Ct
- 882 Belvoir Cir
- 173 Windsor Castle Dr
- 459 Bryson Ct
- 13025 Green Grove Ln
- 925 Chartwell Dr